Ask your data
Ask plain-language questions about ED operations in EDFlow and get charts and reports built from de-identified analytics, with the query shown, plus anomaly alerts. What data it uses and how to review it.
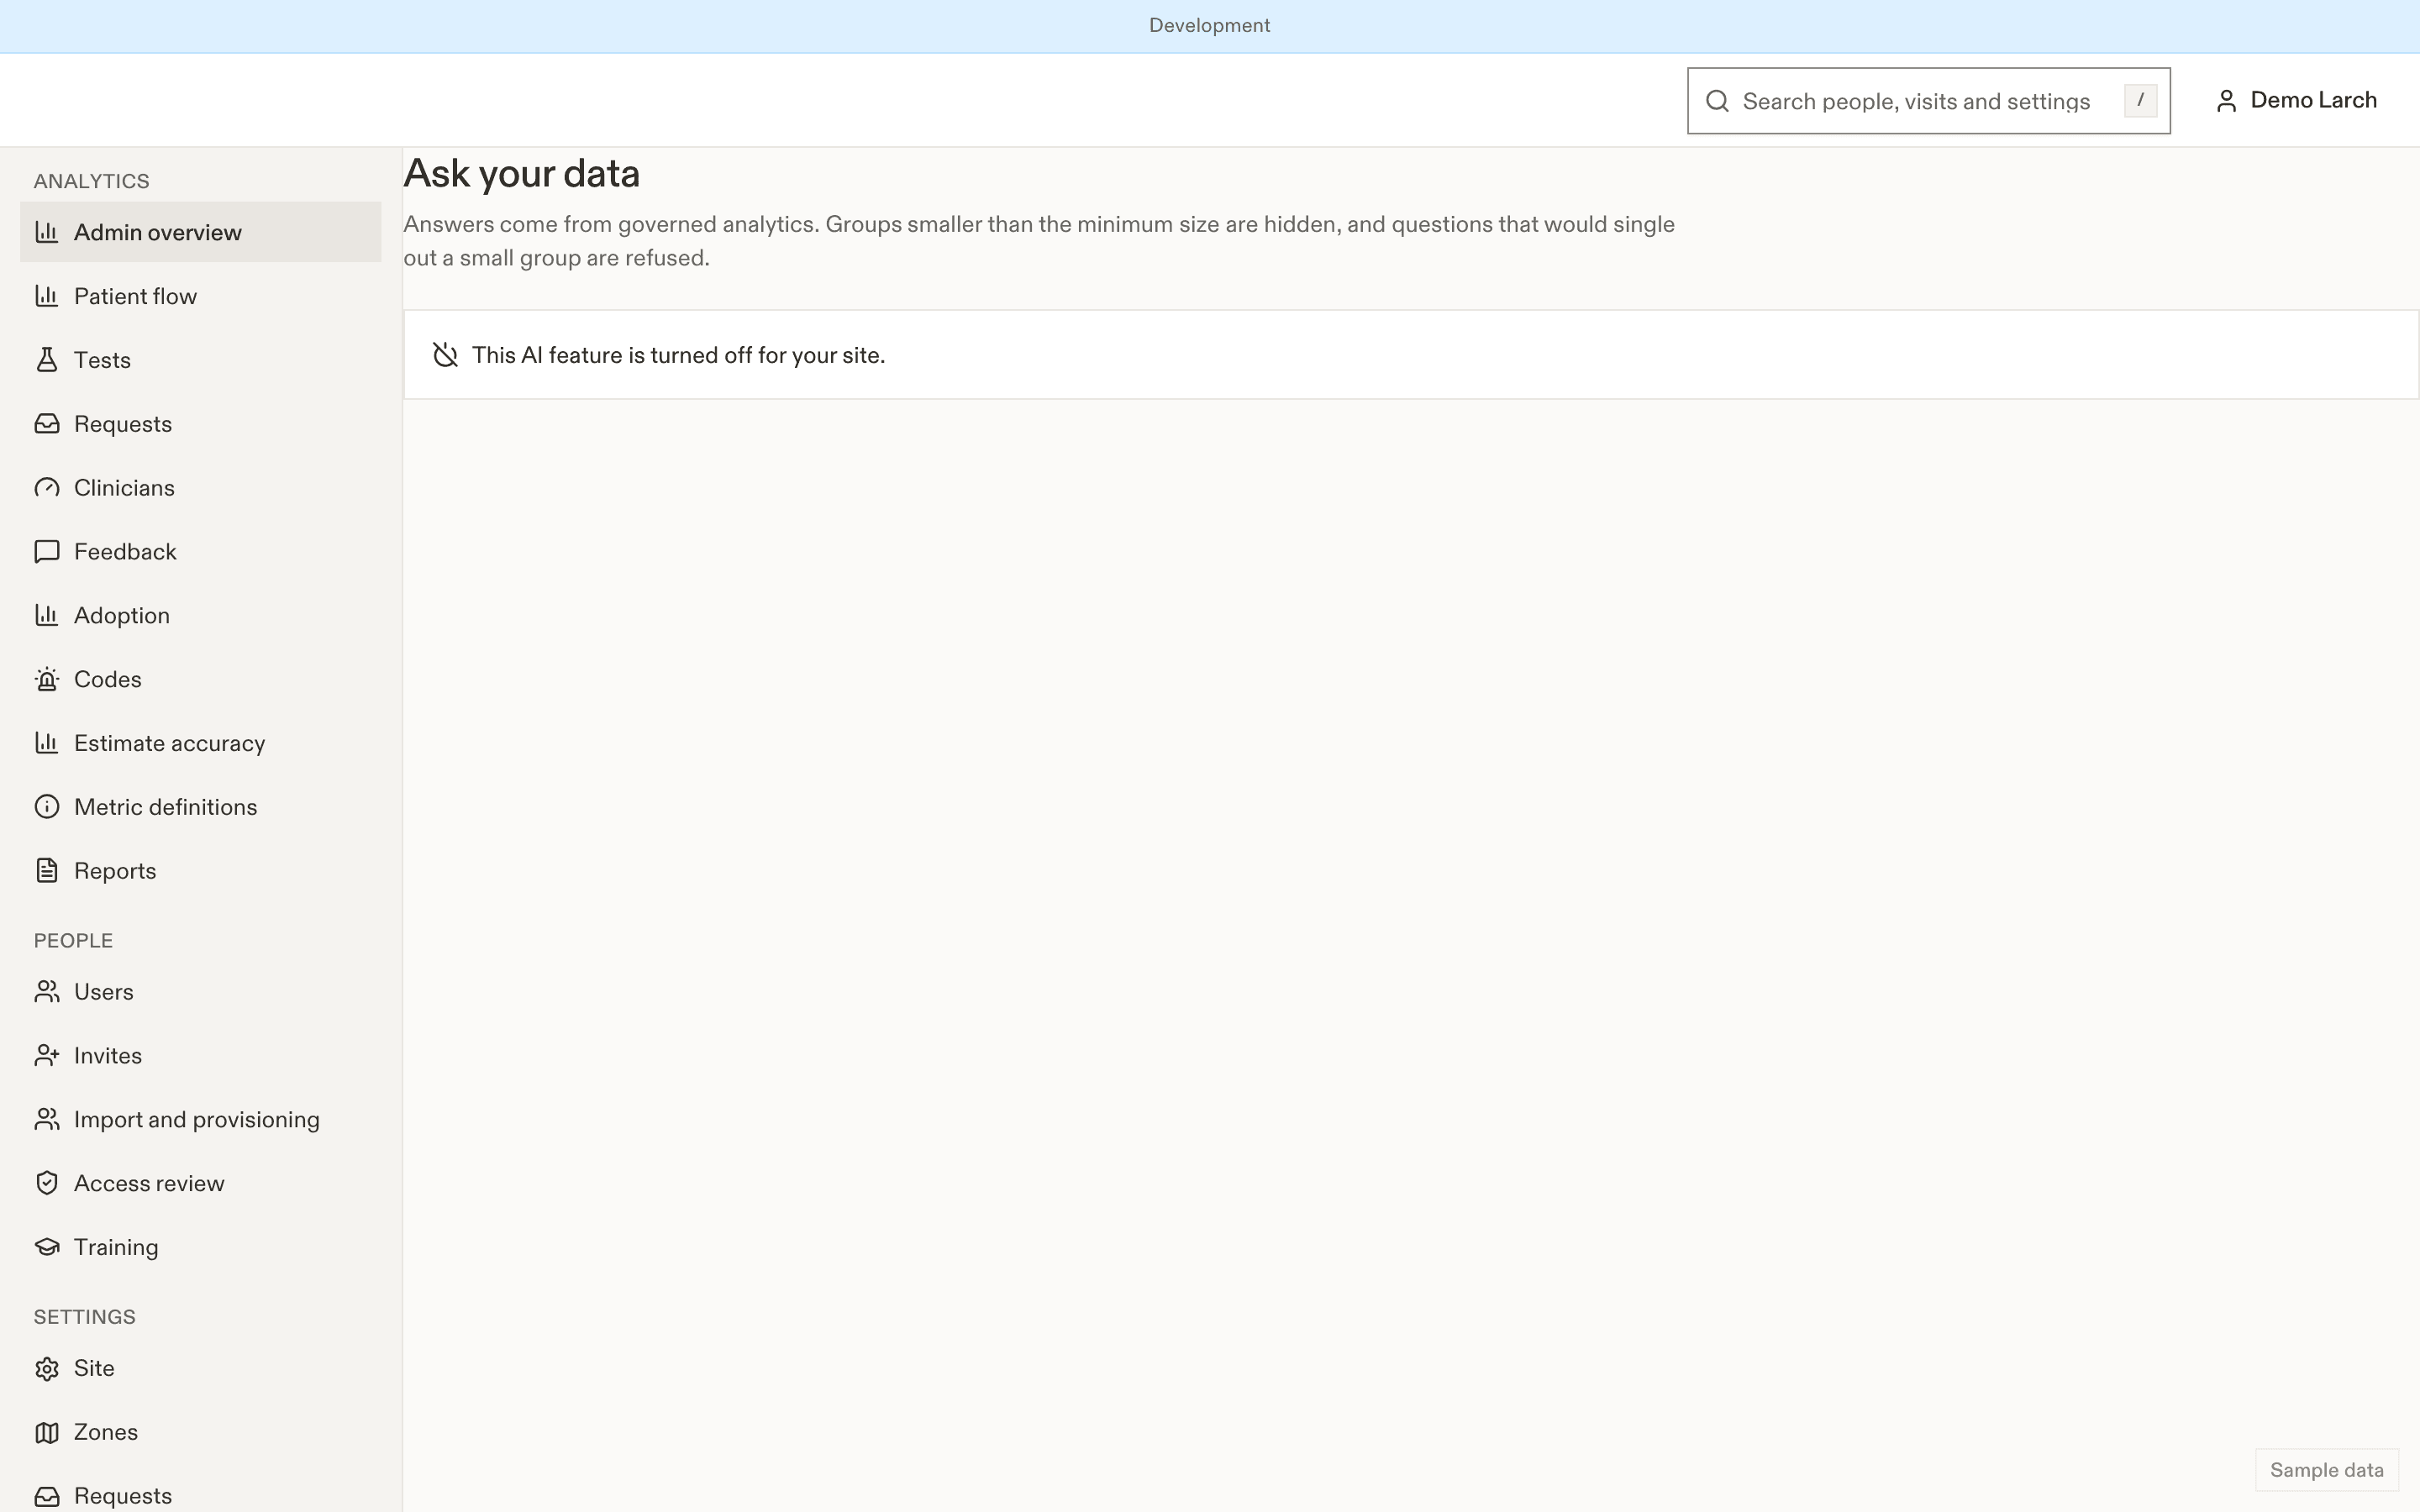
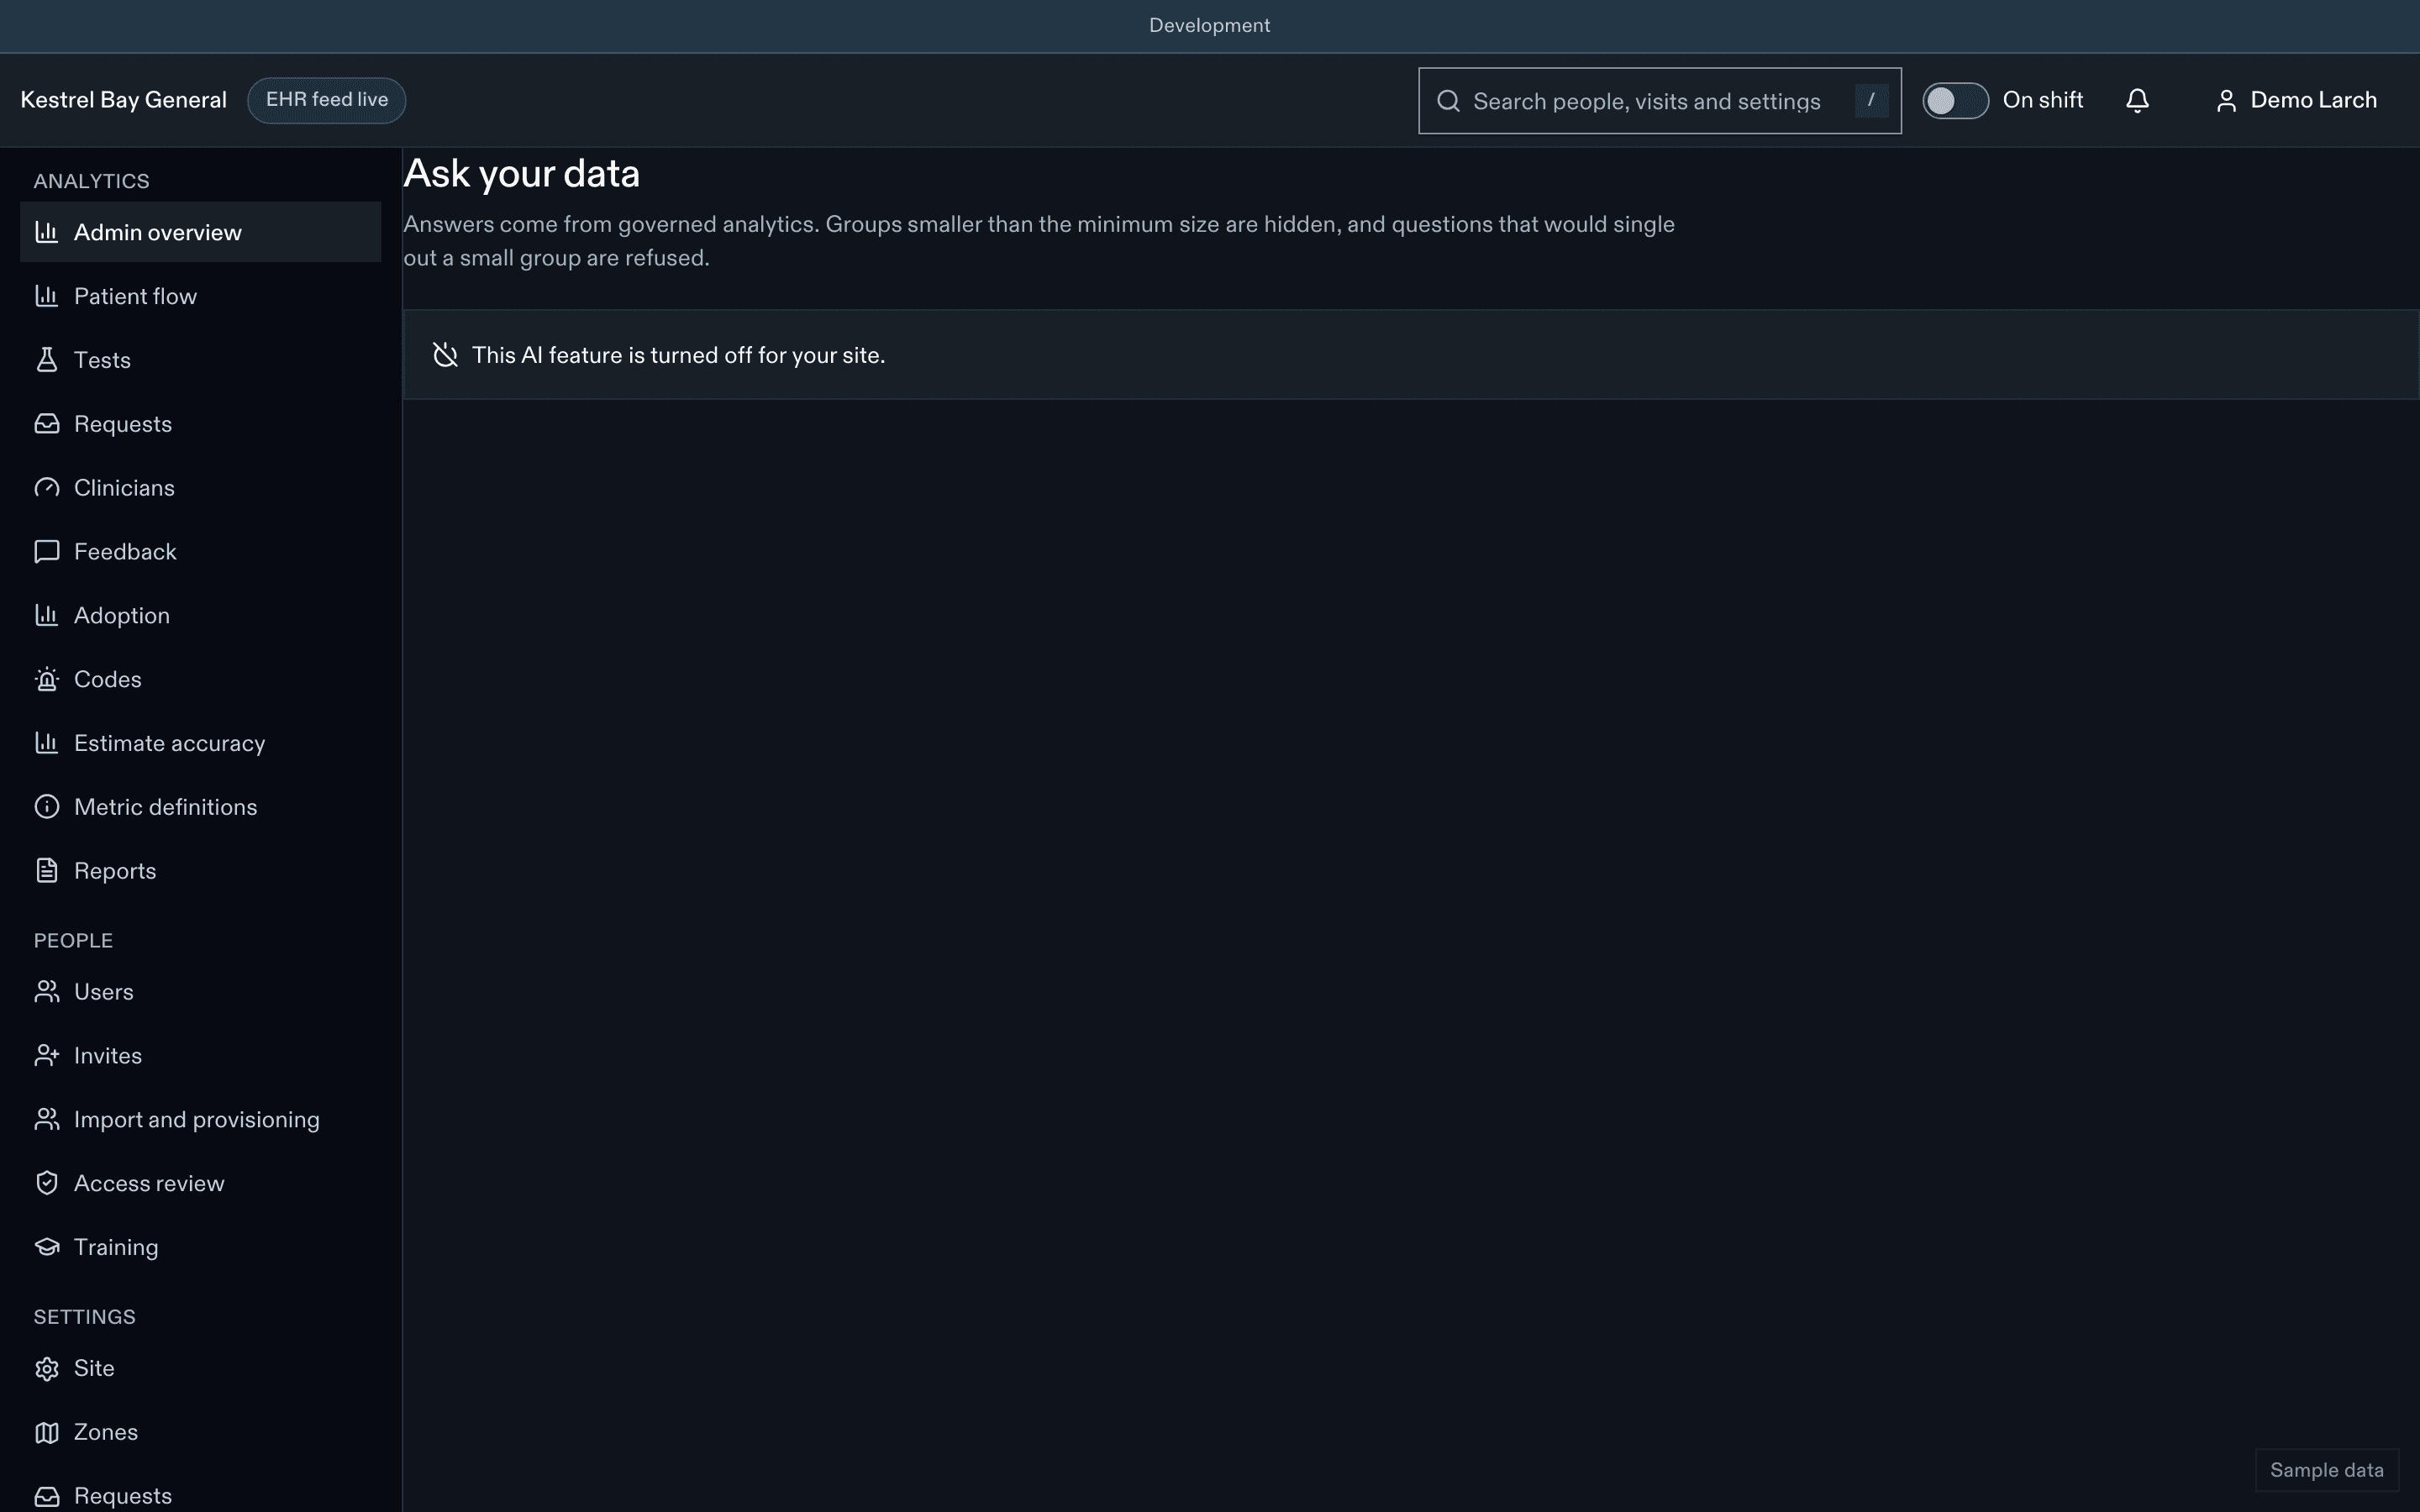
- Turned off by default
Where the site turns it on, Ask your data answers operational questions in plain language with a chart, a table and the definitions it used.
Good questions
- "How did door-to-doctor compare with the same Tuesday last month?"
- "Which hours this week had the longest results-to-seen-again times?"
- "Show LWBS rate by week since the pilot started."
- "Which request types took longest to acknowledge in the waiting room?"
What it uses
- Only the de-identified, aggregate analytics tables and the metric definitions, with the same small-cell suppression as the charts.
- Never a patient record, a name or free text.
- It shows the definitions and filters it applied, so you can check them and open the same view in the normal charts.
What it won't do
- Answer questions about an individual patient.
- Rank or compare named clinicians.
- Predict outcomes for individual patients.
Anomaly alerts
Where enabled, managers get a short explanation when a metric moves far from its usual range (for example a sudden rise in time to reassessment), with links to the charts. Alerts describe what changed; they don't say why.
Review before you share
AI can be wrong. Check a chart against the regular analytics pages before you share it. Every answer is labelled as AI-generated.
Related
Last updated on