Estimate quality
Check that EDFlow wait estimates are honest: coverage of the 9-in-10 ceiling (target 88%), calibration, fallback levels, bucket coverage, the benchmark job and importing historical data.
Patients trust estimates only if they're honest. This page measures them against what actually happened.
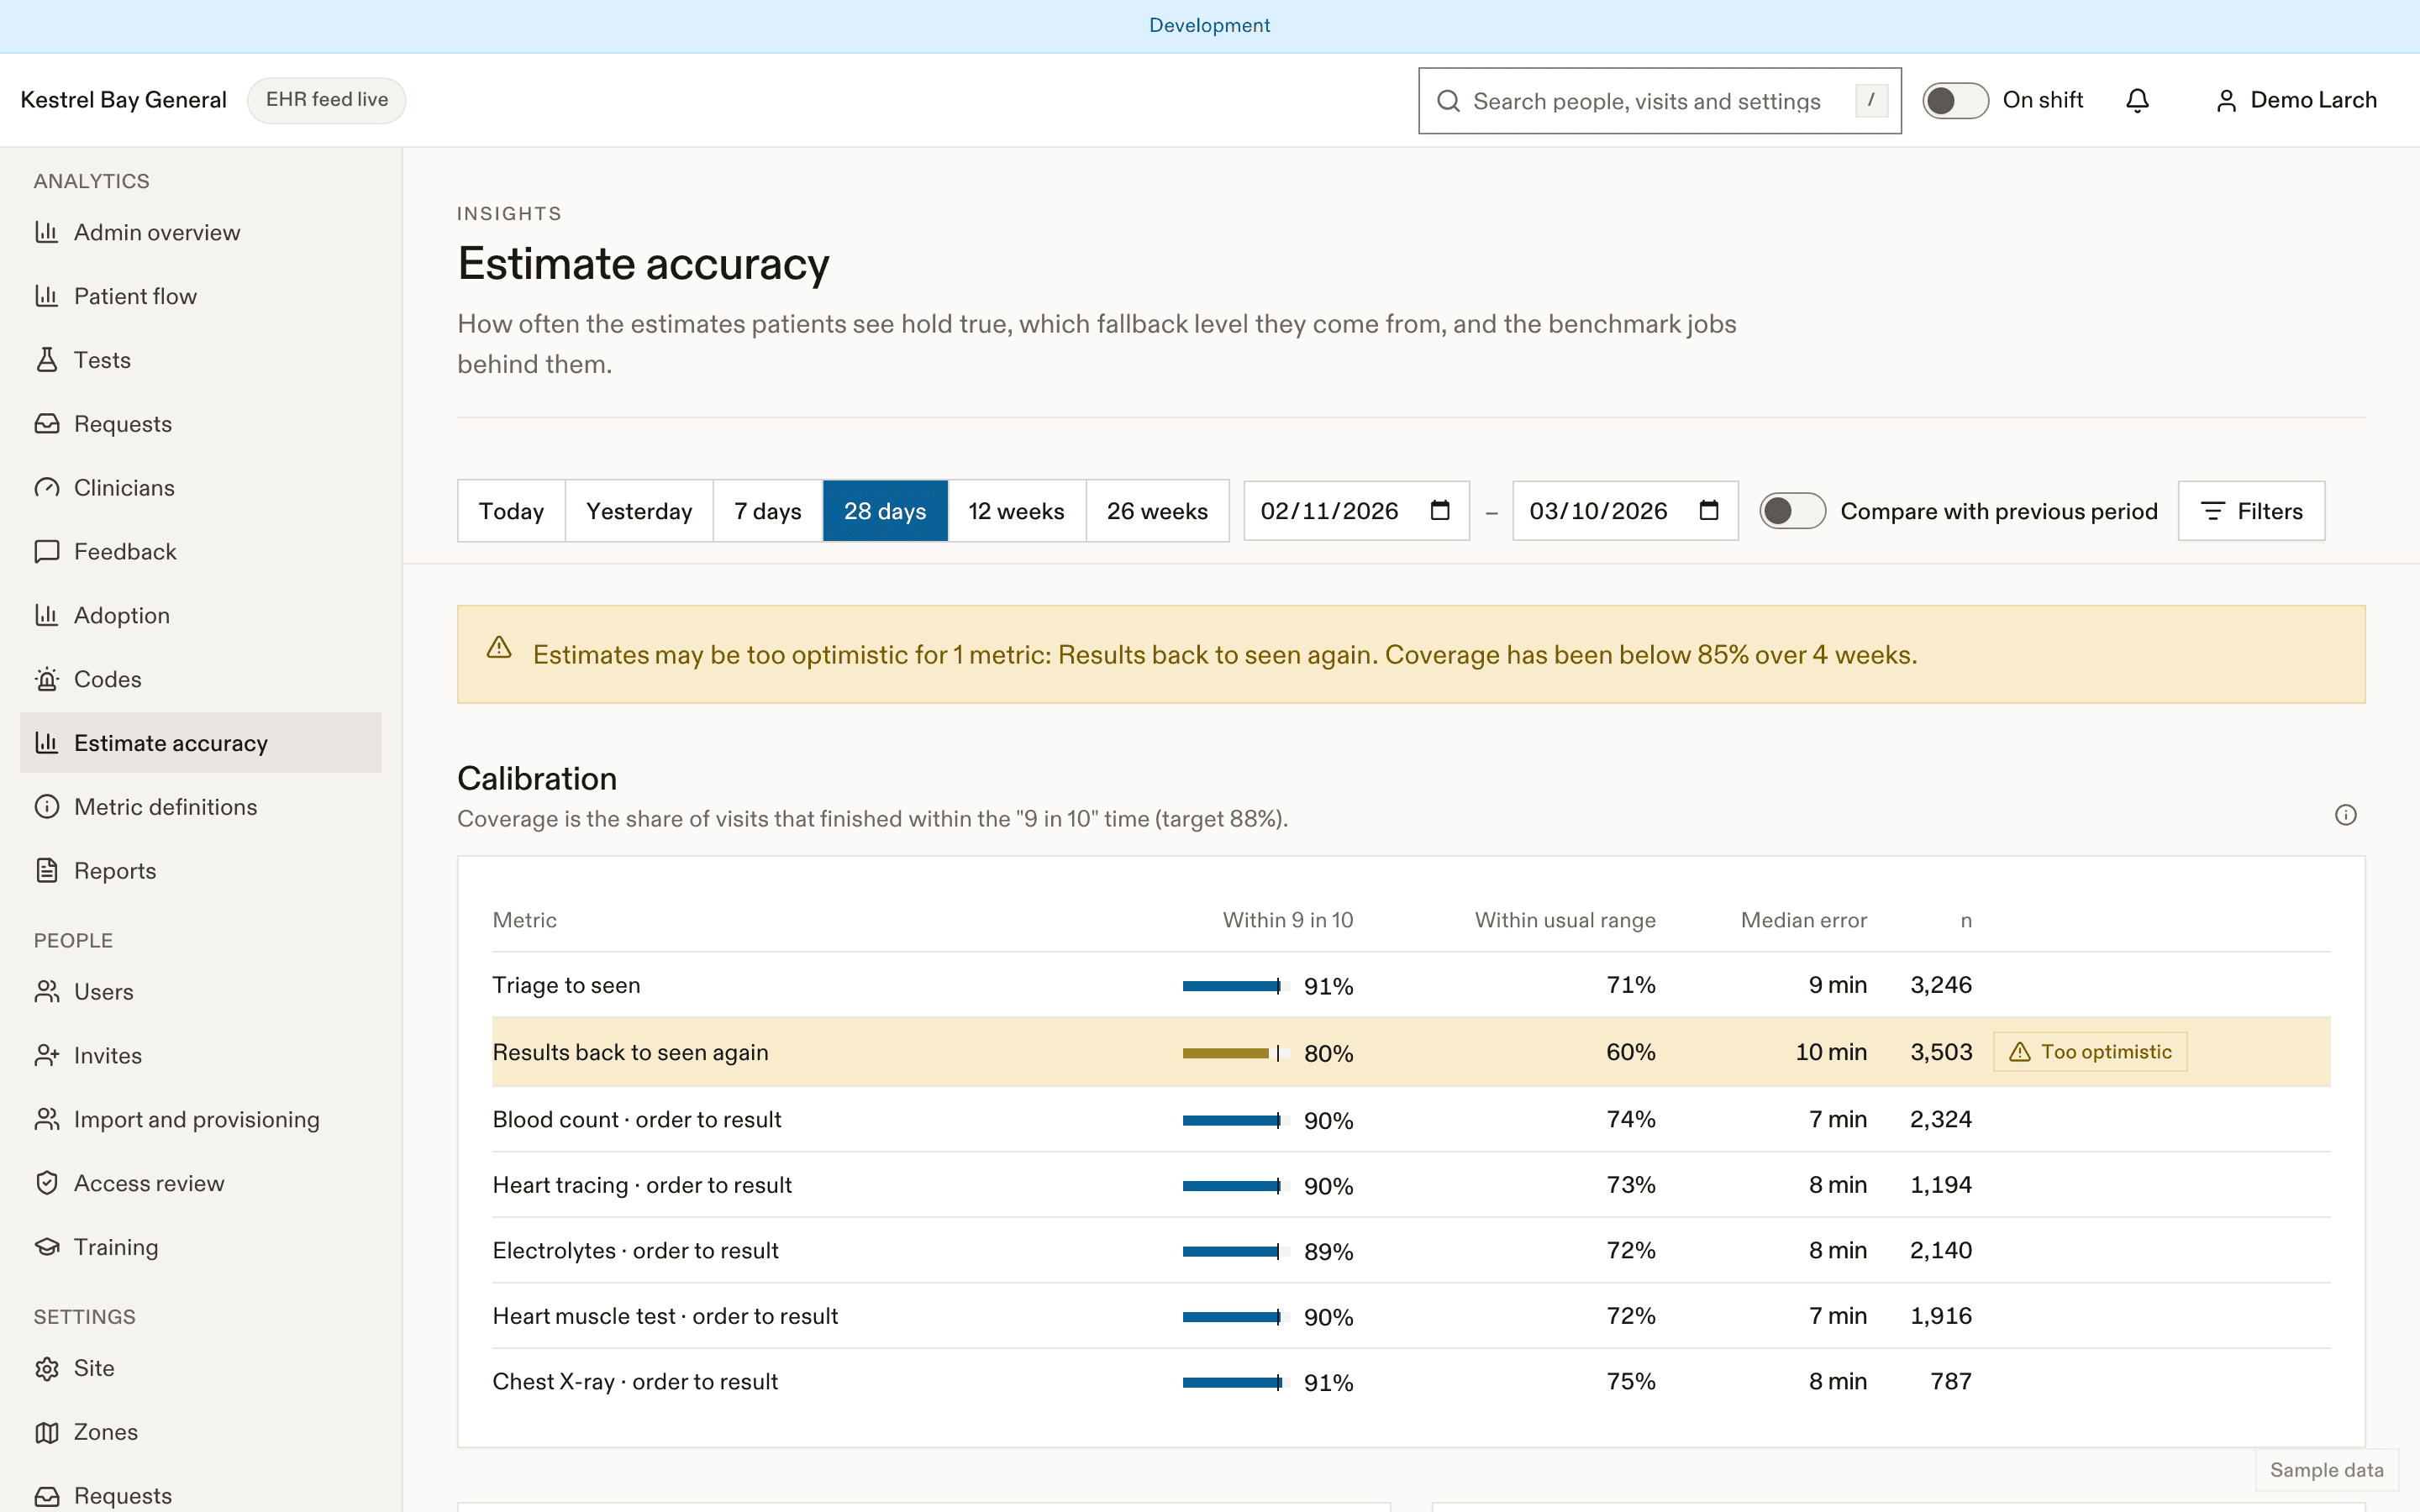
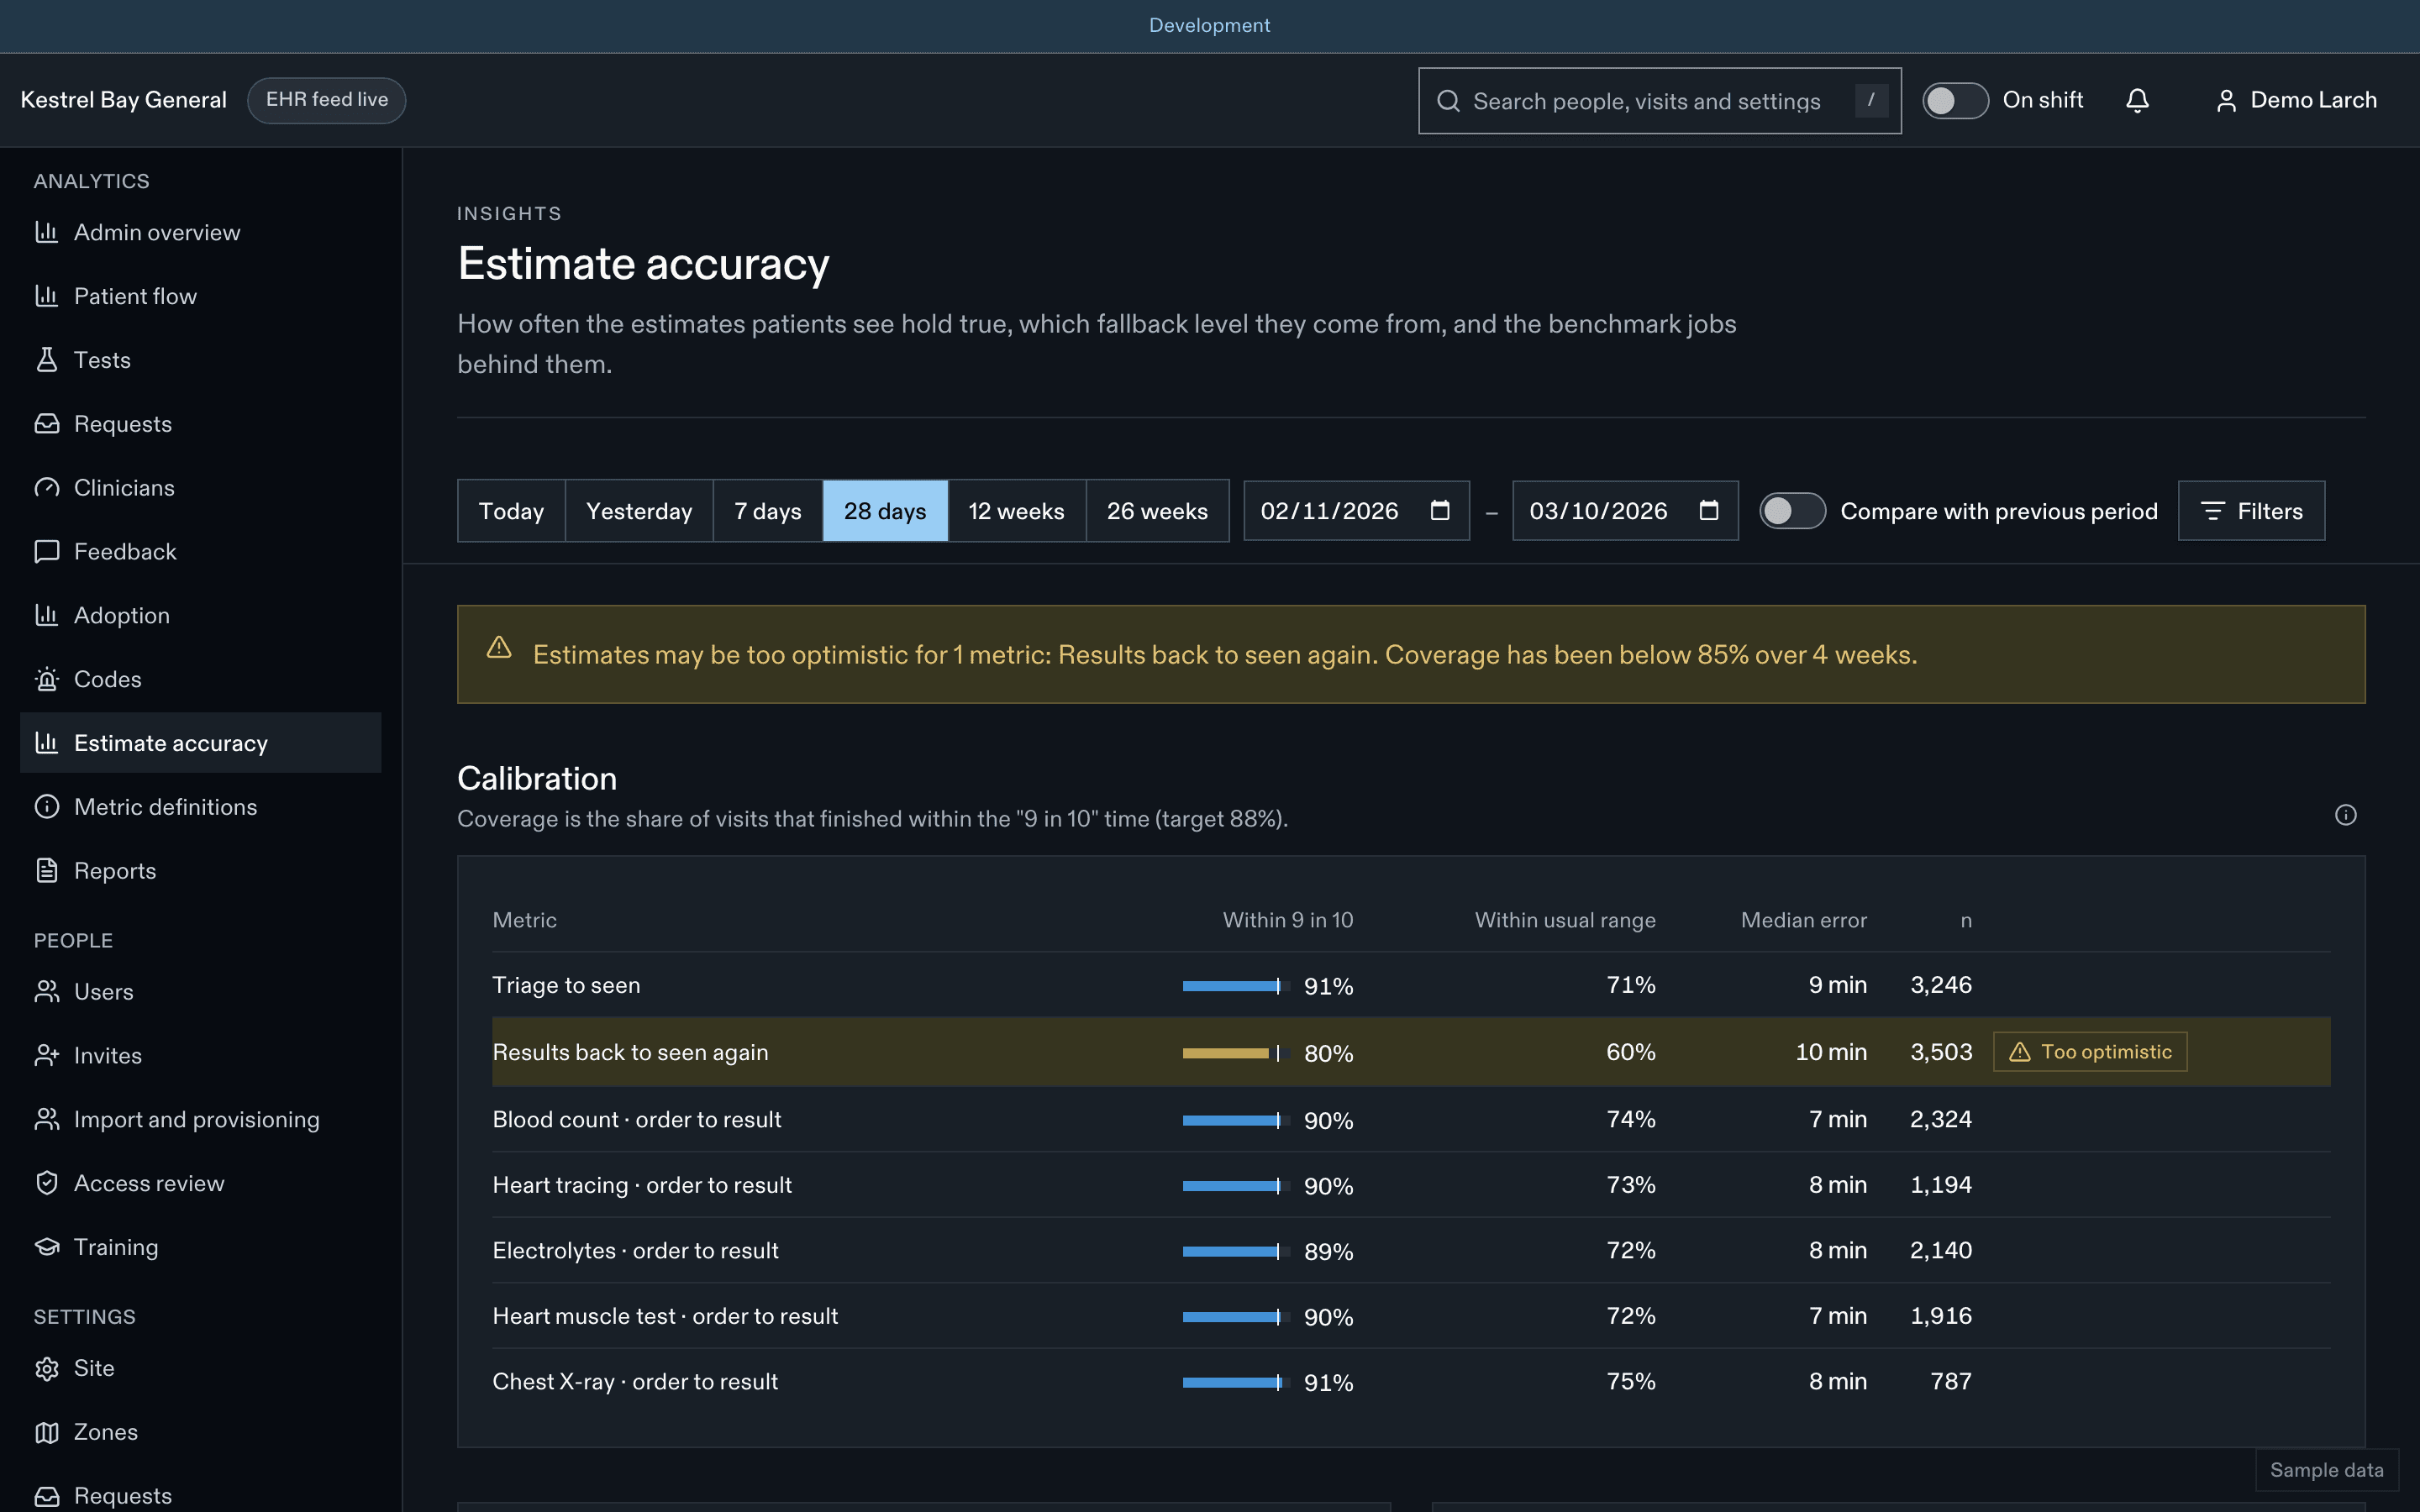
Calibration
For each metric:
- Coverage: the share of completed intervals that finished within the "9 in 10" ceiling the patient saw. Target 88% or more (M-20).
- The share that finished within the "usually" range.
- The median absolute difference from the p50.
A metric whose coverage falls below 85% over 4 weeks is flagged Estimates may be too optimistic.
Fallback levels
The share of estimates served from each level: same weekday and hour, hour ± 1, weekday or weekend, any day at that hour, any time, the catalogue default, or none. A site with little history leans on defaults; importing history helps.
Bucket coverage
A map of samples per weekday-hour bucket for each metric, with buckets below the minimum highlighted.
Benchmark job
Runs hourly for metrics with new samples and fully each night. The page shows its history. Each patient's estimate is snapshotted when the step starts, so a recompute never changes what a patient already sees.
Historical import
Upload de-identified historical intervals (CSV: metric key, dimension, local start, minutes) to calibrate before go-live. Needs integration.manage and a fresh sign-in check. Every row is validated and nothing is applied if any row fails. Imports are audited with counts.
| Setting | Default | Allowed values | What it does |
|---|---|---|---|
estimates.hideBeforePiaForCtas | [1,2] | array | CTAS levels whose estimate is hidden before the patient is seen (SR-07). |
estimates.showBoardingEstimate | false | boolean | Show the boarding estimate (D-32). |
estimates.streamDimension | true | boolean | Use the stream in triage-to-seen buckets (D-33). |
estimates.windowWeeks | 12 | 4–26 weeks | Sample window for estimates (F-05.3). |
estimates.minSamples | 20 | 10–100 count | Minimum samples per ladder level. |
estimates.flowDefaults | [{"dimension":"","metricKey":"flow.arrival_to_triage","p50":10,"p75":15,"p90":30},{"dimension":"1","metricKey":"flow.triage_to_seen","p50":0,"p75":0,"p90":5},{"dimension":"2","metricKey":"flow.triage_to_seen","p50":15,"p75":25,"p90":45},{"dimension":"3","metricKey":"flow.triage_to_seen","p50":60,"p75":90,"p90":180},{"dimension":"4","metricKey":"flow.triage_to_seen","p50":90,"p75":120,"p90":240},{"dimension":"5","metricKey":"flow.triage_to_seen","p50":90,"p75":135,"p90":240},{"dimension":"1","metricKey":"flow.triage_to_pia","p50":0,"p75":0,"p90":5},{"dimension":"2","metricKey":"flow.triage_to_pia","p50":15,"p75":25,"p90":45},{"dimension":"3","metricKey":"flow.triage_to_pia","p50":60,"p75":90,"p90":180},{"dimension":"4","metricKey":"flow.triage_to_pia","p50":90,"p75":120,"p90":240},{"dimension":"5","metricKey":"flow.triage_to_pia","p50":90,"p75":135,"p90":240},{"dimension":"","metricKey":"flow.seen_to_first_order","p50":15,"p75":25,"p90":45},{"dimension":"","metricKey":"flow.seen_to_decision_no_tests","p50":30,"p75":45,"p90":90},{"dimension":"","metricKey":"flow.testing","p50":120,"p75":160,"p90":240},{"dimension":"","metricKey":"flow.results_to_reassessment","p50":30,"p75":45,"p90":90},{"dimension":"","metricKey":"flow.boarding","p50":360,"p75":720,"p90":1440},{"dimension":"","metricKey":"flow.discharge_to_cleared","p50":20,"p75":30,"p90":60},{"dimension":"","metricKey":"flow.cleared_to_departure","p50":5,"p75":10,"p90":20}] | array | Default flow benchmarks (Appendix B.4). |
Related
Last updated on