My metrics for physicians
Per-physician step metrics in EDFlow: definitions, the private self view against blinded peer ranges, case-mix context, and why there are never ranks.
- Turned off by default
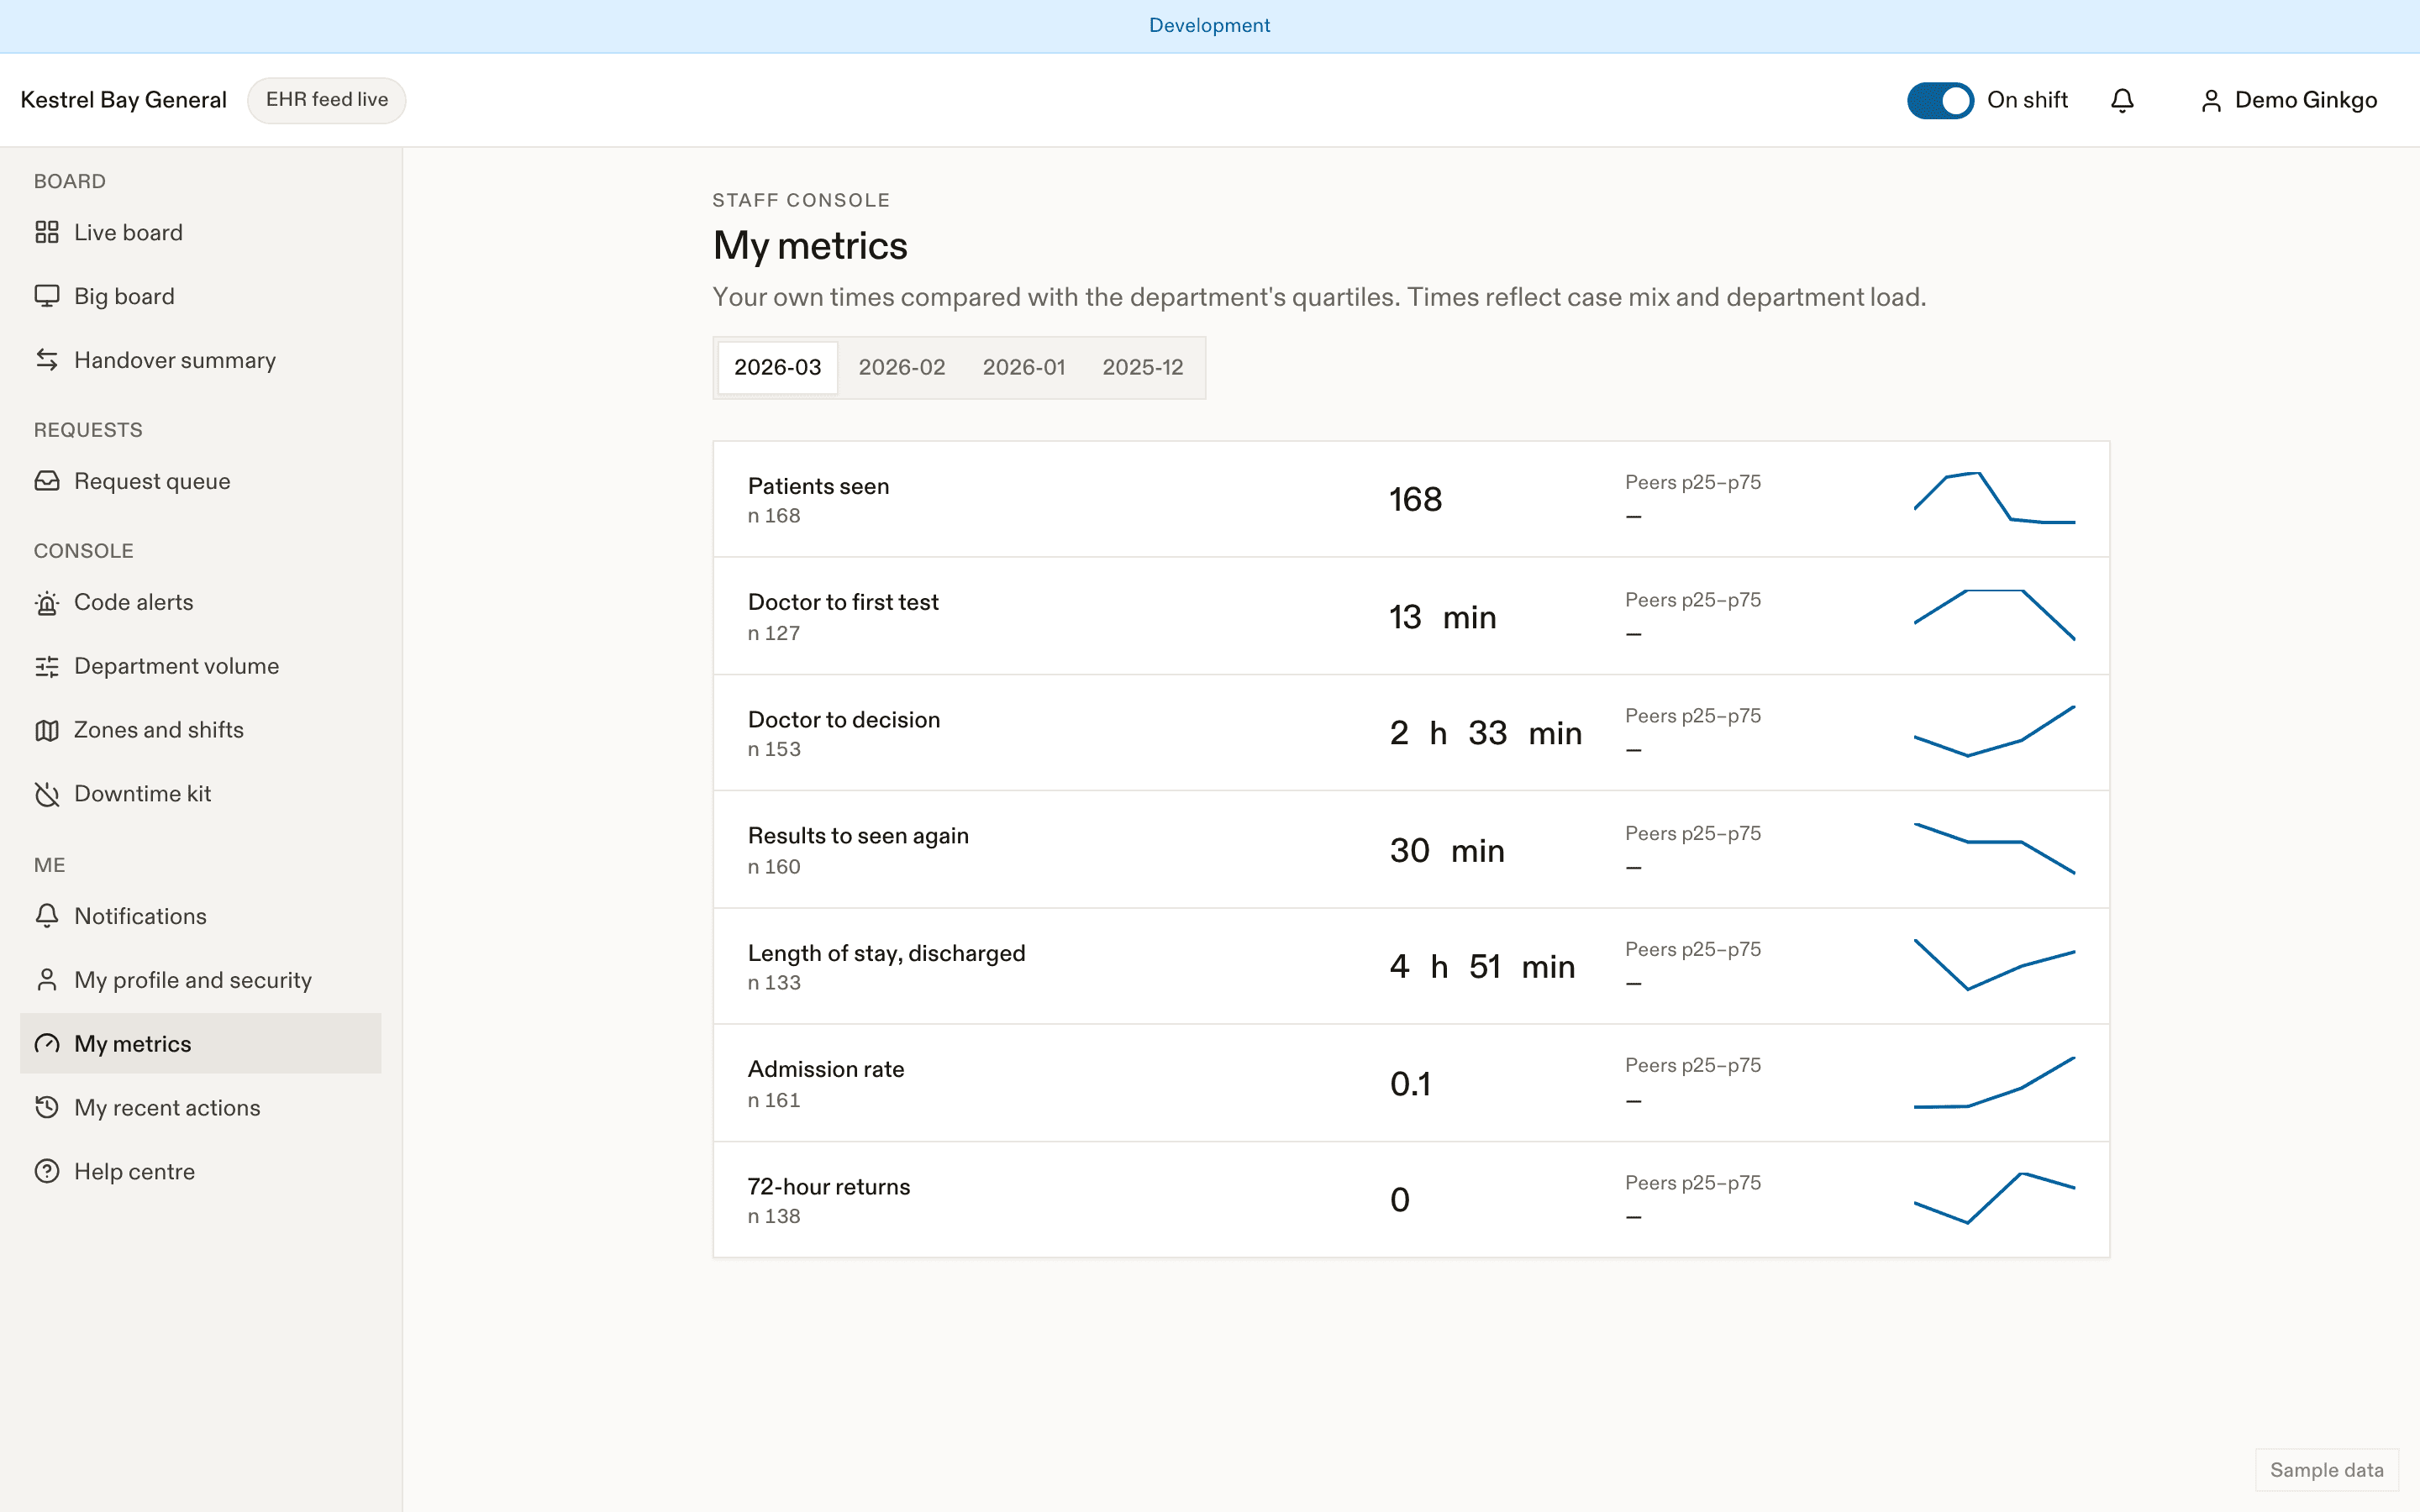
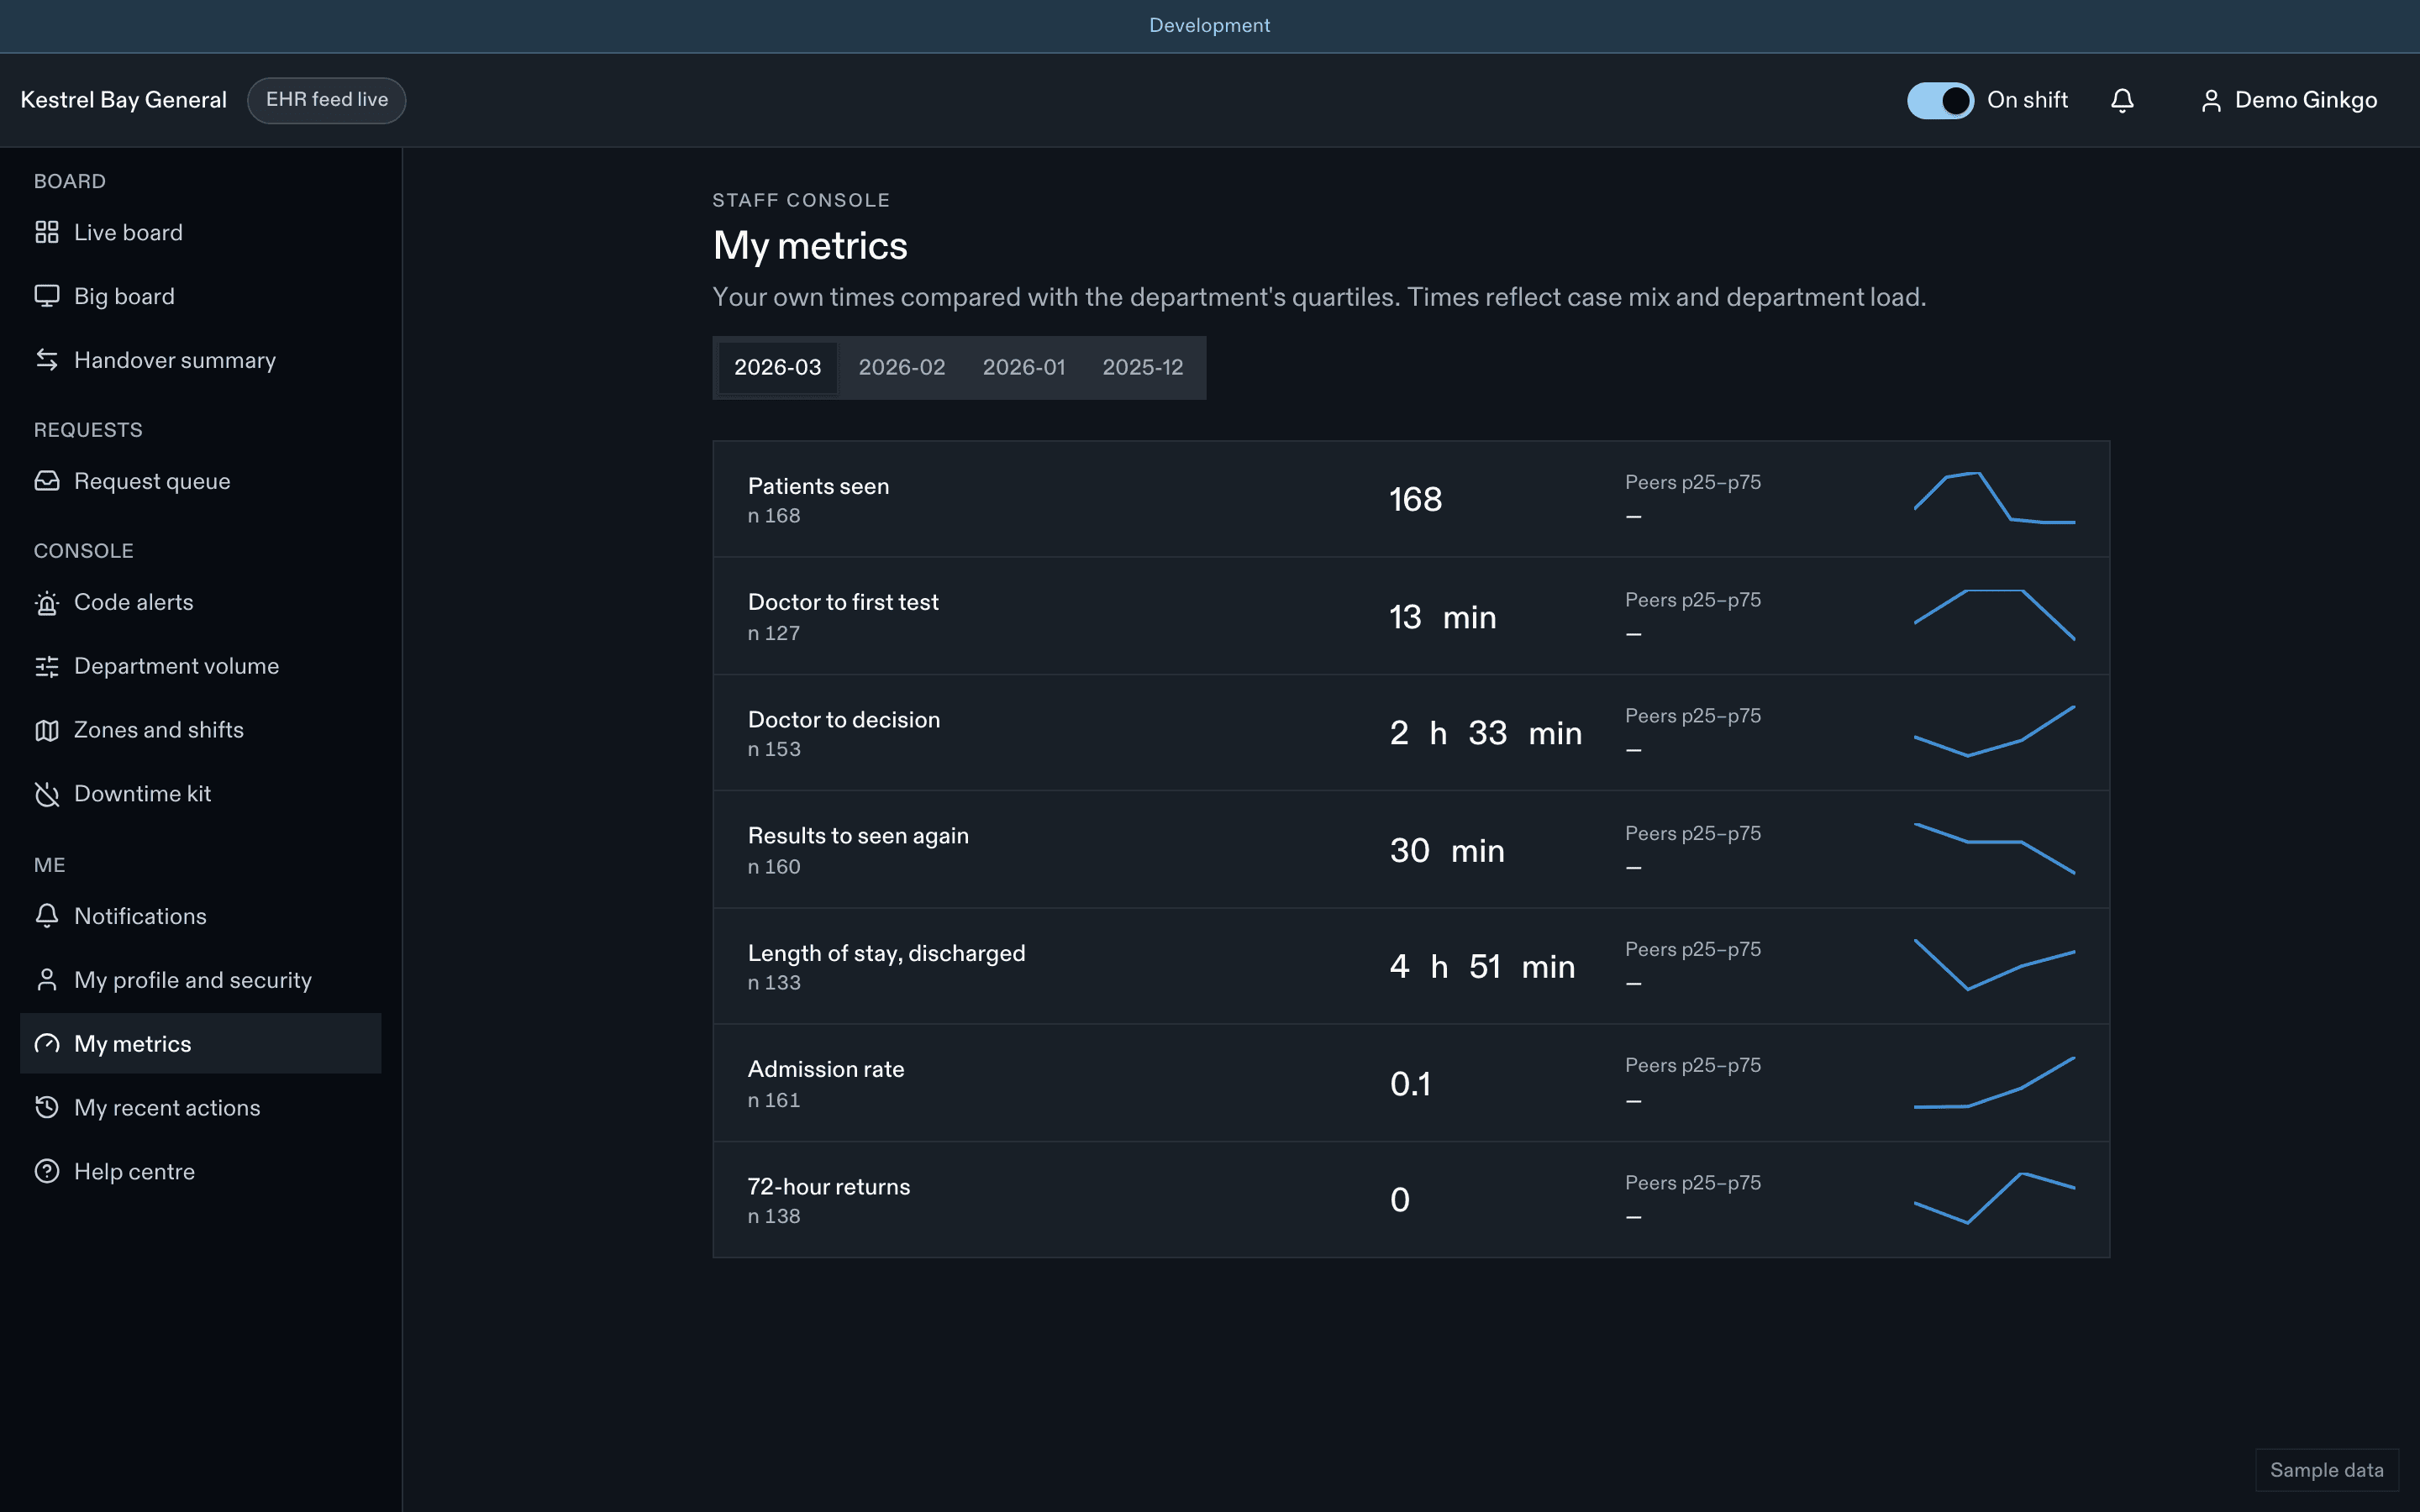
Clinician metrics are off by default. When your site turns them on, My profile → My metrics shows your own monthly values next to the range of your peers.
The metrics
| Id | Metric | Definition | Unit |
|---|---|---|---|
C-01 | Patients seen | Visits where the clinician set the “seen” milestone, per month and per scheduled clinical hour. | count |
C-02 | Doctor to first test | Median time from being seen to the first test ordered (segment S3). | minutes |
C-03 | Doctor to decision | Time from being seen to the disposition decision, for visits the clinician both saw and decided. Handed-over visits are reported separately. | minutes |
C-04 | Results to seen again | Time from results back to the next reassessment or decision (segment S5), for cycles while the clinician was attending. | minutes |
C-05 | Length of stay, discharged | Median length of stay of discharged visits where the clinician made the decision and held the visit for most of its length. Handed-over visits are reported separately. | minutes |
C-06 | Admission rate | Share of the clinician's decisions that were admissions. | rate |
C-07 | 72-hour returns | Unplanned 72-hour returns (K-25a) for the clinician's discharged-home decisions. | rate |
C-08 | Imaging ordering rate | Share of the visits the clinician saw with at least one imaging order (X-ray, CT, ultrasound or MRI). Read it with the case mix beside it. | rate |
C-09 | Share of visits seen | The clinician's visits seen as a share of every visit seen at the site in the month: a relative volume, never a rank. | rate |
Two rows are context rather than timings: Imaging ordering rate is the share of the visits you saw with at least one imaging order (cancelled orders are not counted), and Share of visits seen is your visits seen over every visit seen at the site that month, a relative volume with no trend line and never a rank. Read both with the case mix beside them.
Each segment is attributed to the clinician responsible during it, from the care-team history. The decision clinician is the one on the disposition. Visits handed over before the decision are reported separately and excluded from the default view. Per-hour values use the physician shift schedule.
Your self view
- Your own monthly values against the peer range: the middle half (p25 to p75) of peers of the same clinician type with at least 20 visits that month.
- A 6-month trend.
- Case mix beside every metric: CTAS mix, age bands, ambulance share, night-shift share. Read your numbers with it.
What others see
- Managers with the blinded view see each clinician as a dot labelled "Clinician A, B…", relabelled randomly every month, never sorted by value. Clinicians with fewer than 20 visits in the month are hidden.
- A named view exists only when the site turns it on explicitly, and every view is audited.
- Never ranks, league tables or public display.
Related
Last updated on