Analytics
EDFlow analytics conventions and every metric definition: time zones, T0, percentiles, small-cell suppression, Ontario LOS groups, filters, annotations and exports, generated from the same definitions the computations use.
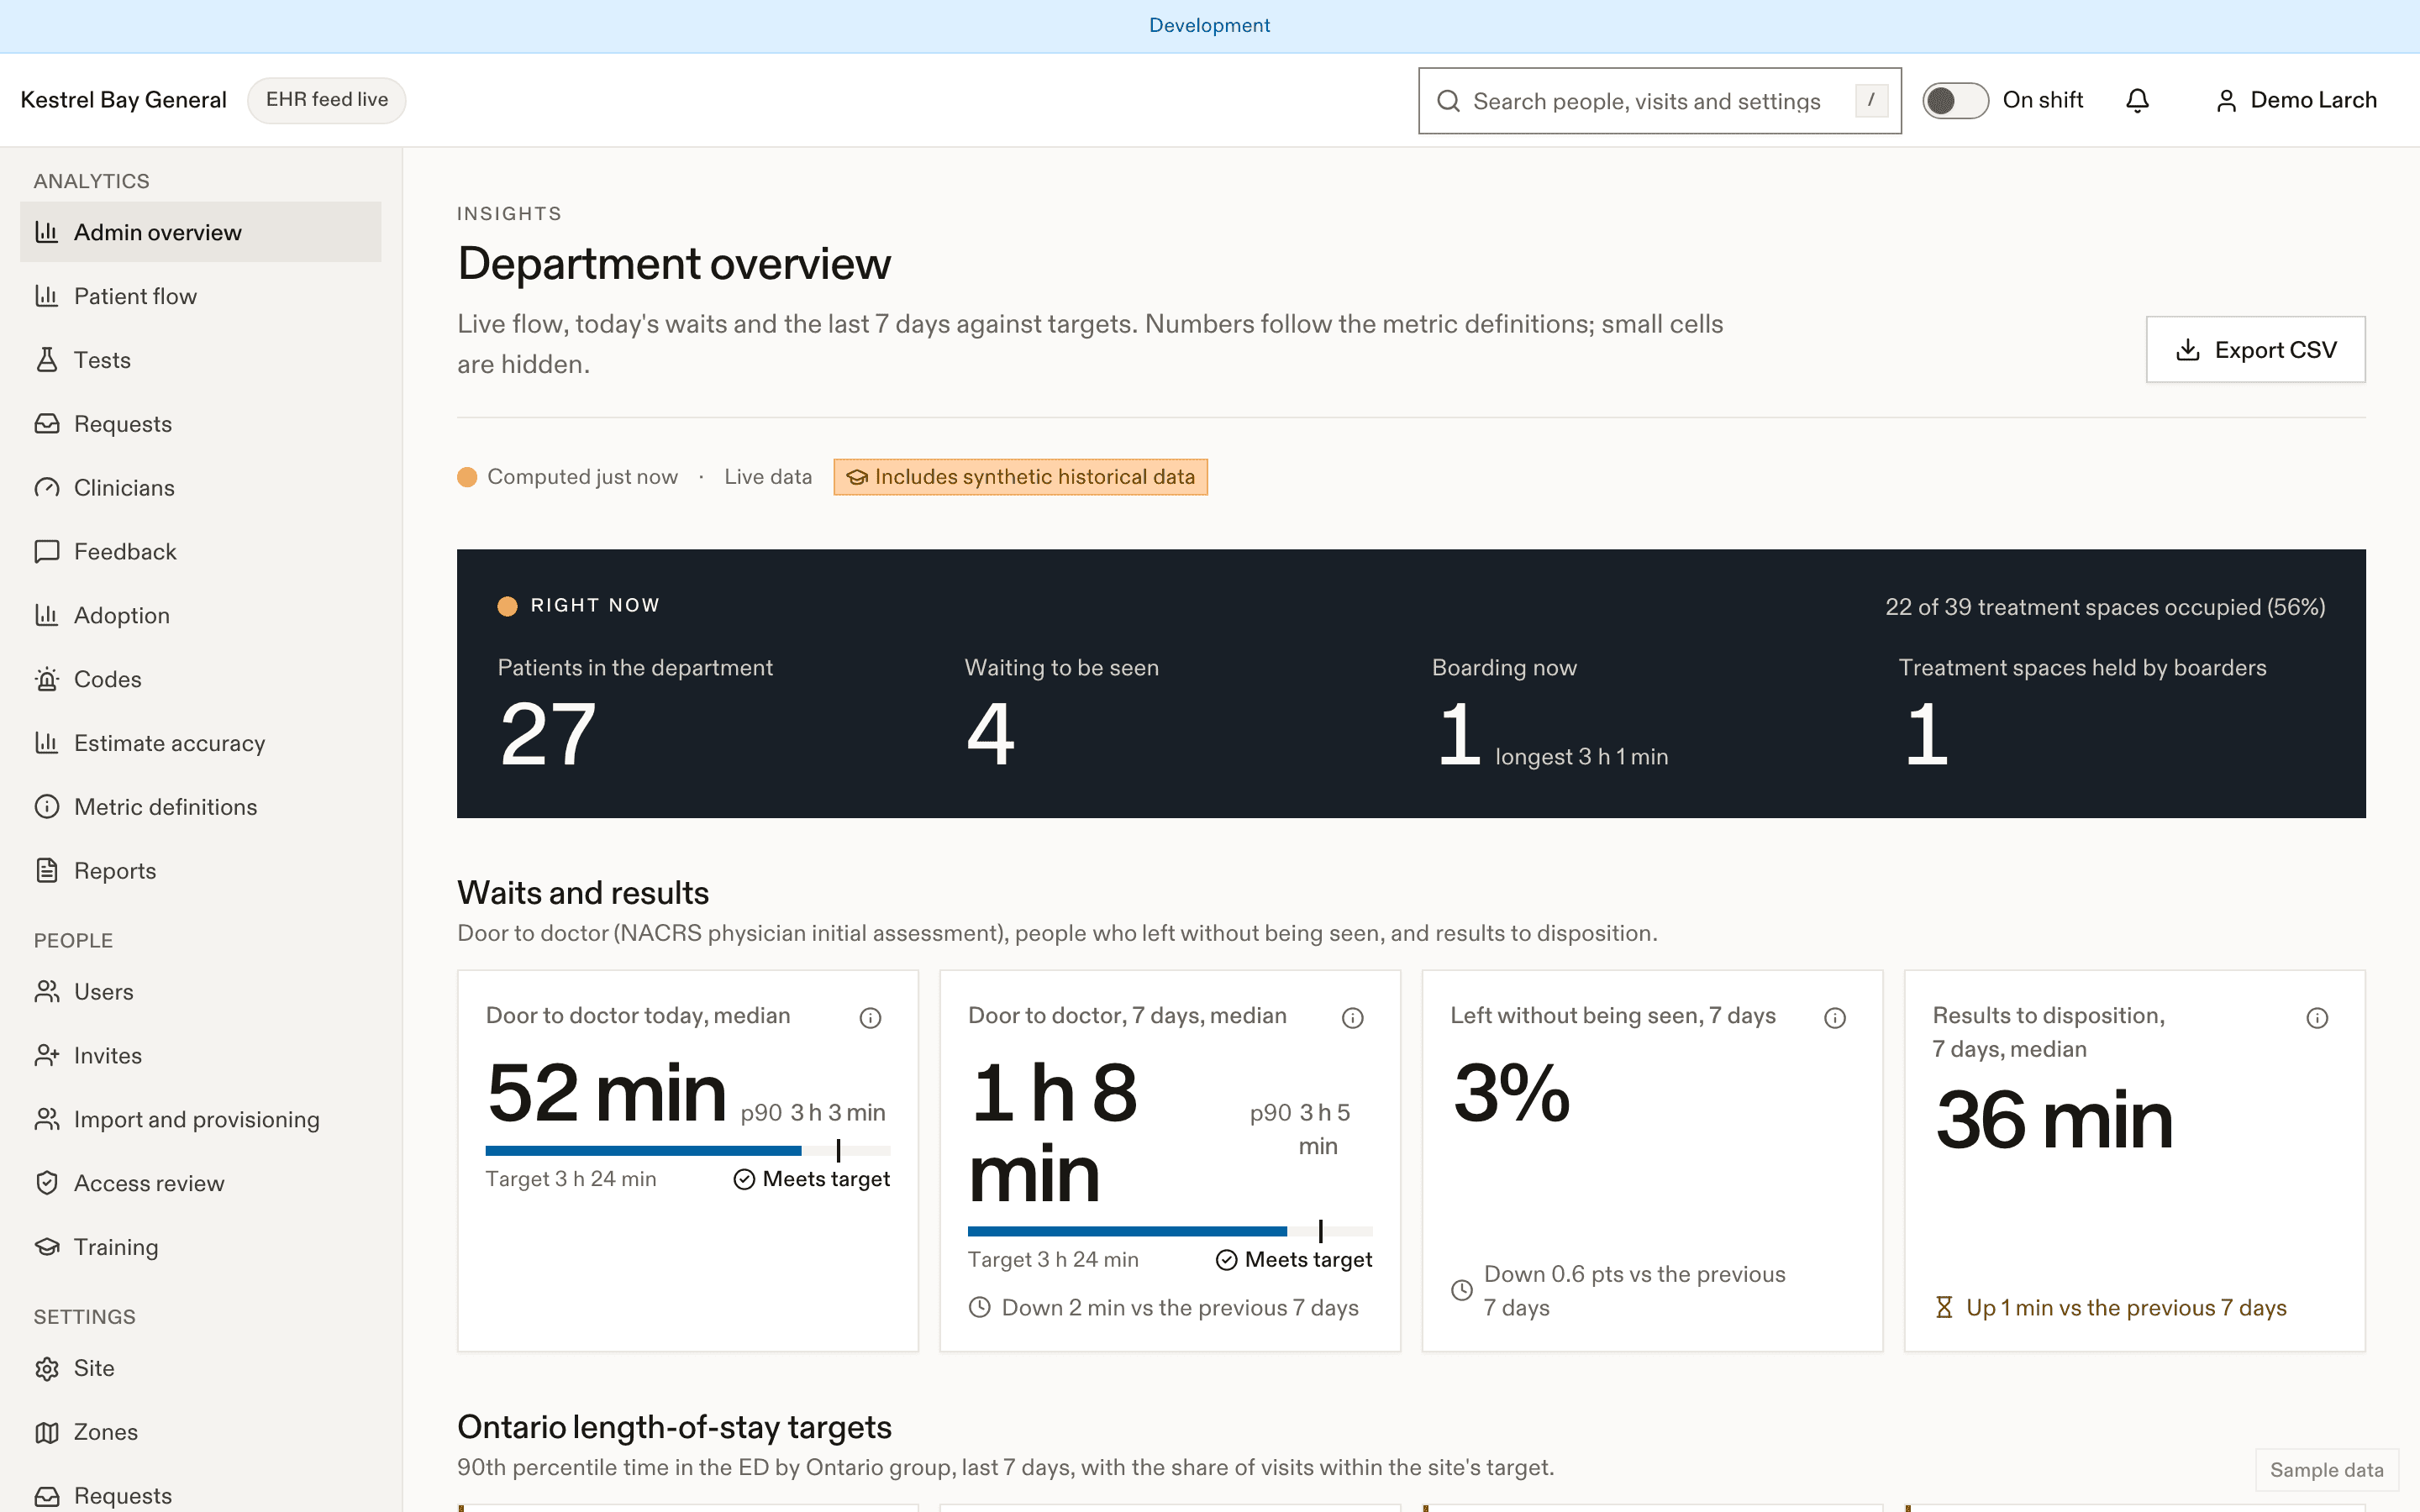
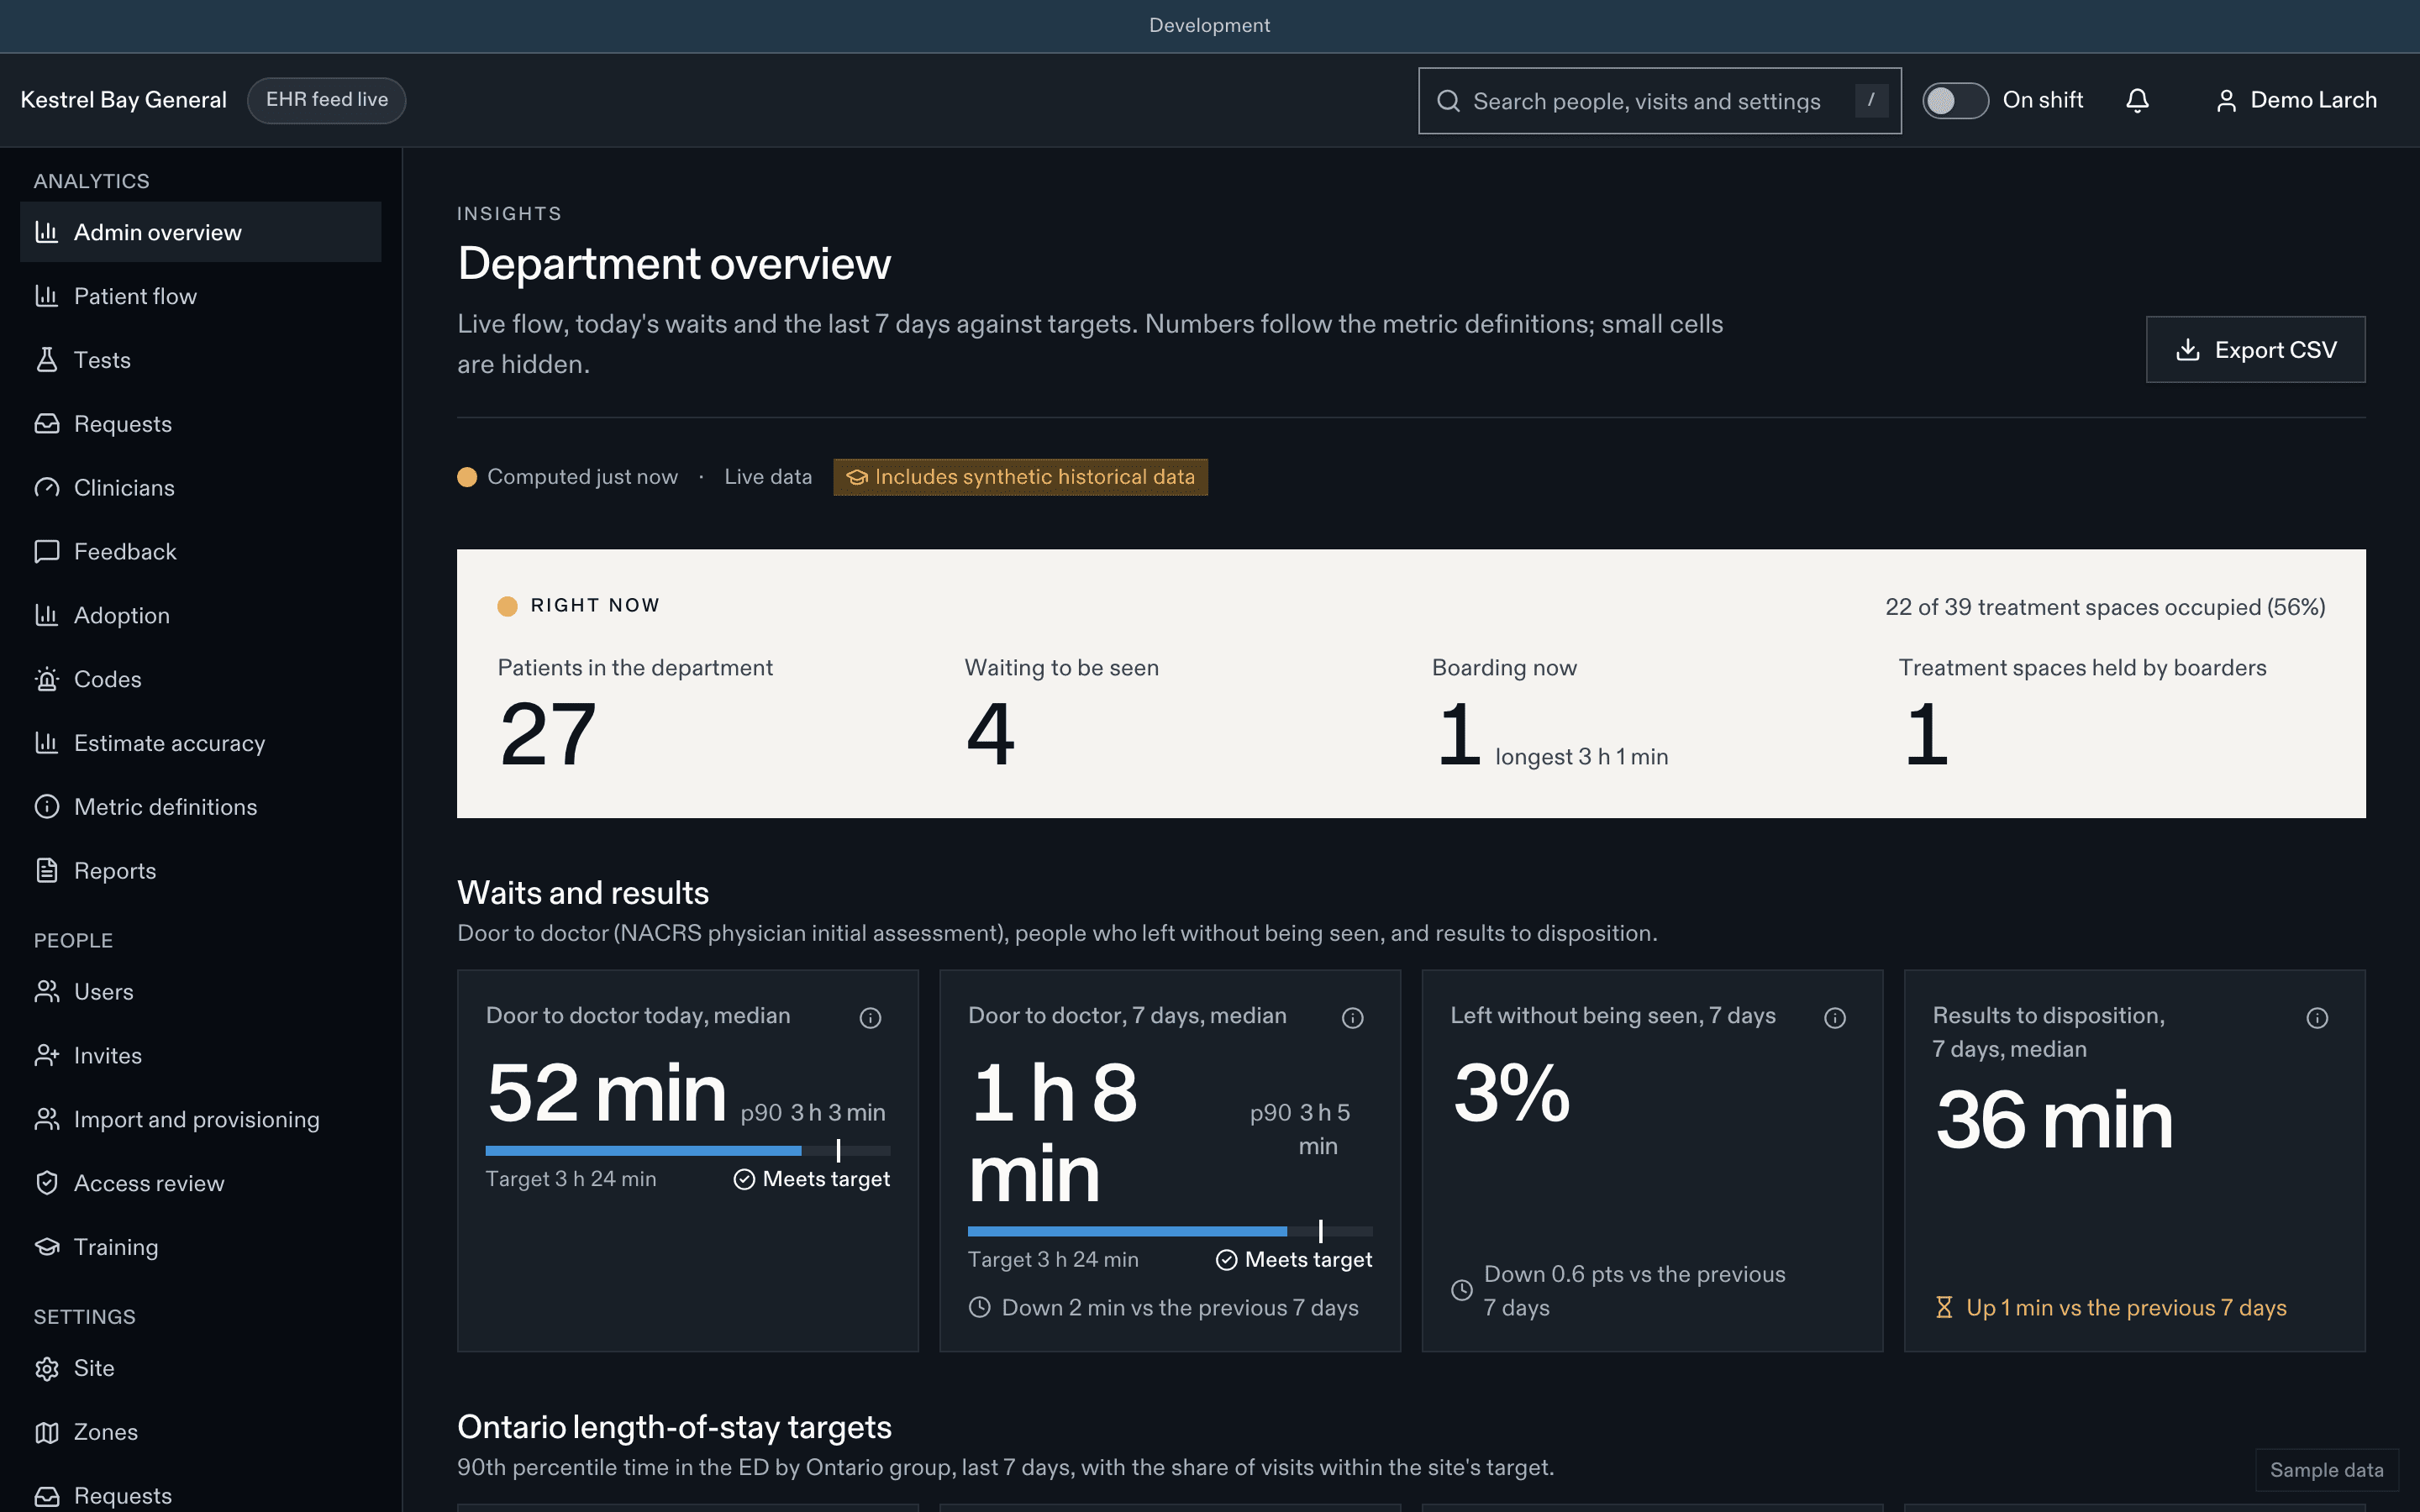
EDFlow analytics follow Ontario QIP and NACRS definitions. Every chart's info button opens the same definition object the computation imports, so the numbers and their definitions can't drift apart.
Conventions
- Time zone: the site's. Days start at local midnight; weekday and hour buckets are local and safe across daylight-saving changes.
- Which period a visit belongs to: the period containing its T0, the earlier of arrival and triage.
- Always excluded: cancelled visits, training visits, demo sessions (for adoption).
- Percentiles: linear interpolation, completed intervals only, whole minutes on screen.
- Small cells: any number from fewer than 5 visits shows "—" ("Fewer than 5 visits").
- Disposition groups: discharged; admitted (admit, observation); transferred; left (without being seen, before treatment complete, against advice); other.
- Ontario LOS groups: admitted; non-admitted CTAS 1–3; non-admitted CTAS 4–5, with site targets (by default 8 h, 8 h and 4 h at p90).
| Setting | Default | Allowed values | What it does |
|---|---|---|---|
analytics.clinicianMetrics | false | boolean | Clinician-level metrics (EHR §12). (Reduces privacy) |
analytics.namedClinicianMetrics | false | boolean | Named clinician metrics; requires clinician metrics (D-20). (Reduces privacy) |
analytics.nurseMetrics | false | boolean | Nurse self-view metrics. (Reduces privacy) |
analytics.minCell | 5 | 5–20 count | Small-cell suppression threshold. (Reduces privacy) |
analytics.ontarioTargets.admitted | 480 | 30–2880 minutes | Ontario target, admitted (D-48). |
analytics.ontarioTargets.nonAdmittedHigh | 480 | 30–2880 minutes | Ontario target, non-admitted CTAS 1–3. |
analytics.ontarioTargets.nonAdmittedLow | 240 | 30–2880 minutes | Ontario target, non-admitted CTAS 4–5. |
analytics.ontarioTargets.emsOffload | 30 | 5–240 minutes | Ontario target, EMS offload. |
Filters
Site, date range (today to 12 weeks or custom), compare with the previous period, weekday, hour range, CTAS group, Ontario LOS group, zone, stream, disposition, arrival mode, language (including EHR preferred languages), age band. Filters live in the URL, so a link reproduces the view.
Annotations
Add a dated note ("Pilot start", "HIS downtime") and it appears on every time-series chart for the site. Annotations can exclude their dates from benchmarks.
Exports
With analytics.export, every chart exports its de-identified aggregate as CSV, with suppression applied. Every export is audited. See Reports and exports.
Accessibility
Every chart has a Show as table alternative and direct labels; colour is never the only encoding.
Pages
| Page | Question it answers |
|---|---|
| Flow and bottlenecks | Where is time being lost? |
| Test turnaround | How long does each test take here, by hour? |
| Requests | How quickly do we respond, and to what? |
| Clinician metrics | Per-physician step times, with governance |
| Feedback | What do patients say? |
| Adoption and equity | Who uses EDFlow, and who doesn't? |
| Codes and delays | How often do codes happen, and what do they do to waits? |
| Estimate quality | Are the estimates patients see honest? |
| Ask your data | Plain-language questions, where enabled |
Key metrics
| Id | Metric | Definition | Unit |
|---|---|---|---|
K-01 | Census now | Visits in the department right now. | count |
K-02 | Waiting to be seen now | Patients checked in or triaged who have not yet been seen. | count |
K-03 | Door-to-doctor (PIA wait) | Time from arrival (or triage, if earlier) to the physician initial assessment. | minutes |
K-04 | ED length of stay | Time from arrival (or triage, if earlier) to leaving the department, overall and by disposition group. | minutes |
K-05 | Left without being seen | Share of departed visits that left without being seen. | rate |
K-06 | Left after being seen | Share of departed visits that left after being seen: before treatment was complete, or against medical advice, each also shown on its own. | rate |
K-07 | Boarding time | Time from the decision to admit to leaving the department (segment S6a). | minutes |
K-08 | Boarding now | Admitted patients still waiting in the department for a bed, and the longest wait since the decision. | count |
K-09 | Results to disposition | Primary: time from the last result becoming complete to the disposition decision. Secondary: time from each results-back moment to the next reassessment or decision, with the share closed by a staff tap. Defined identically before and after go-live (D-26). | minutes |
K-10 | Test turnaround | Time from order to result, per test and priority class. | minutes |
K-11 | Collection to result | Time from specimen collection to result, for lab tests. | minutes |
K-12 | Request first response | Time from a patient request to the first staff response (acknowledgement, Going now or Can't go; the resolution if there was none). For urgent requests, also the time to an in-person response. | minutes |
K-13 | Request time to resolve | Time from a patient request to its resolution. | minutes |
K-14 | Request SLA compliance | Share of eligible requests acknowledged within their target. A request closed at departure without a response counts as a breach when it was older than its target. | rate |
K-15 | Escalation rate | Share of urgent and high requests that escalated. | rate |
K-16 | Activation rate | Share of visits with a card issued where the patient signed in at least once. | rate |
K-17 | Notification opt-in | Share of activated visits with push notifications or SMS updates turned on. | rate |
K-18 | Family share and open rates | Share of activated visits that shared updates with family, and share of family links that were opened. | rate |
K-19 | Feedback response rate | Share of activated visits that departed (not closed) where the patient answered the survey. | rate |
K-20 | Told why about a long wait | Share of patients with a long wait who were told why (Q1). | rate |
K-21 | Explained understandably | Share answering “Usually” or “Always” when asked if things were explained in a way they understood (Q2). | rate |
K-22 | App helpfulness | Share answering “A lot” when asked whether the app helped them know what was happening (Q3). | rate |
K-23 | Overall rating | Share of overall ratings of 9 or 10 out of 10 (top box), and the mean rating (Q5). | score |
K-24 | Information for after leaving | Share answering “Yes, completely” about information for what to do after leaving (Q4). | rate |
K-25 | 72-hour return rate | Share of discharged-home visits followed by an unplanned return to the same site within 72 hours (K-25a), and by a return leading to admission (K-25b). Planned returns are excluded. | rate |
K-26 | Estimate coverage | Share of completed intervals that finished within the displayed “9 in 10” ceiling, the share within the “usually” range, and the median absolute error against the typical time. | rate |
K-27 | Code impact | How much longer people waited to be seen during codes that notified patients, compared with similar hours without a code. Descriptive, not causal. | ratio |
K-28 | Time in volume level | Hours spent at each volume level per day. | hours |
K-29 | Arrivals per hour | Arrivals in each local hour, against the median of the same weekday and hour over the previous 8 weeks. | count |
K-30 | Live segment overruns | Active visits whose current segment has lasted longer than its 90th percentile, per segment. | count |
K-31 | Length of stay by Ontario group | 90th percentile of length of stay for each Ontario group (admitted; non-admitted CTAS 1 to 3; non-admitted CTAS 4 to 5), and the share within the site's targets. | minutes |
K-32 | Ambulance offload time | Time from ambulance arrival to the transfer of care, and the share within the target (default 30 minutes). | minutes |
K-33 | Boarder-hours | Hours admitted patients spent waiting for a bed in the department per day, and boarders in treatment spaces now. | hours |
K-34 | Alerts per nurse per hour | Sounds and pushes delivered to nursing roles per nurse on-shift hour, by role and shift. | per_hour |
K-35 | Waiting-room reassessment timeliness | Share of waiting CTAS 2 to 5 visits reassessed within the site's interval. | rate |
K-36 | Call-backs not present | Share of call-backs marked “called, not present”, and share of LWBS visits with an unanswered call-back. | rate |
Flow segments
| Id | Metric | Definition | Unit |
|---|---|---|---|
S1 | Arrival to triage | Arrival to triage. | minutes |
S2 | Triage to seen | Triage to being seen, by stream and CTAS (D-33). | minutes |
S2n | Triage to PIA | Triage to the NACRS physician initial assessment (analytics only). | minutes |
S3 | Seen to first test | Being seen to the first test ordered (staff only). | minutes |
S3b | Seen to decision (no tests) | Being seen to the decision, for visits without tests. | minutes |
S4 | Testing | Testing: from the later of being seen and the first result-bearing order to the last moment all results were complete before the decision. | minutes |
S5 | Results back to seen again | Results back to being seen again (explicit or inferred) or to the decision. | minutes |
S5o | Observation | Planned observation (no benchmark; the planned duration is shown instead). Never flagged as a reassessment bottleneck (D-45). | minutes |
S6 | Decision to cleared to leave | Decision to discharge to cleared to leave (or departure when never cleared). | minutes |
S6c | Cleared to left | Cleared to leave to leaving the department (staff only). | minutes |
S6a | Decision to left (admitted) | Decision to admit to leaving the department (boarding). | minutes |
S7 | Consult requested to specialist seen | Consult requested to the specialist seeing the patient, per service. | minutes |
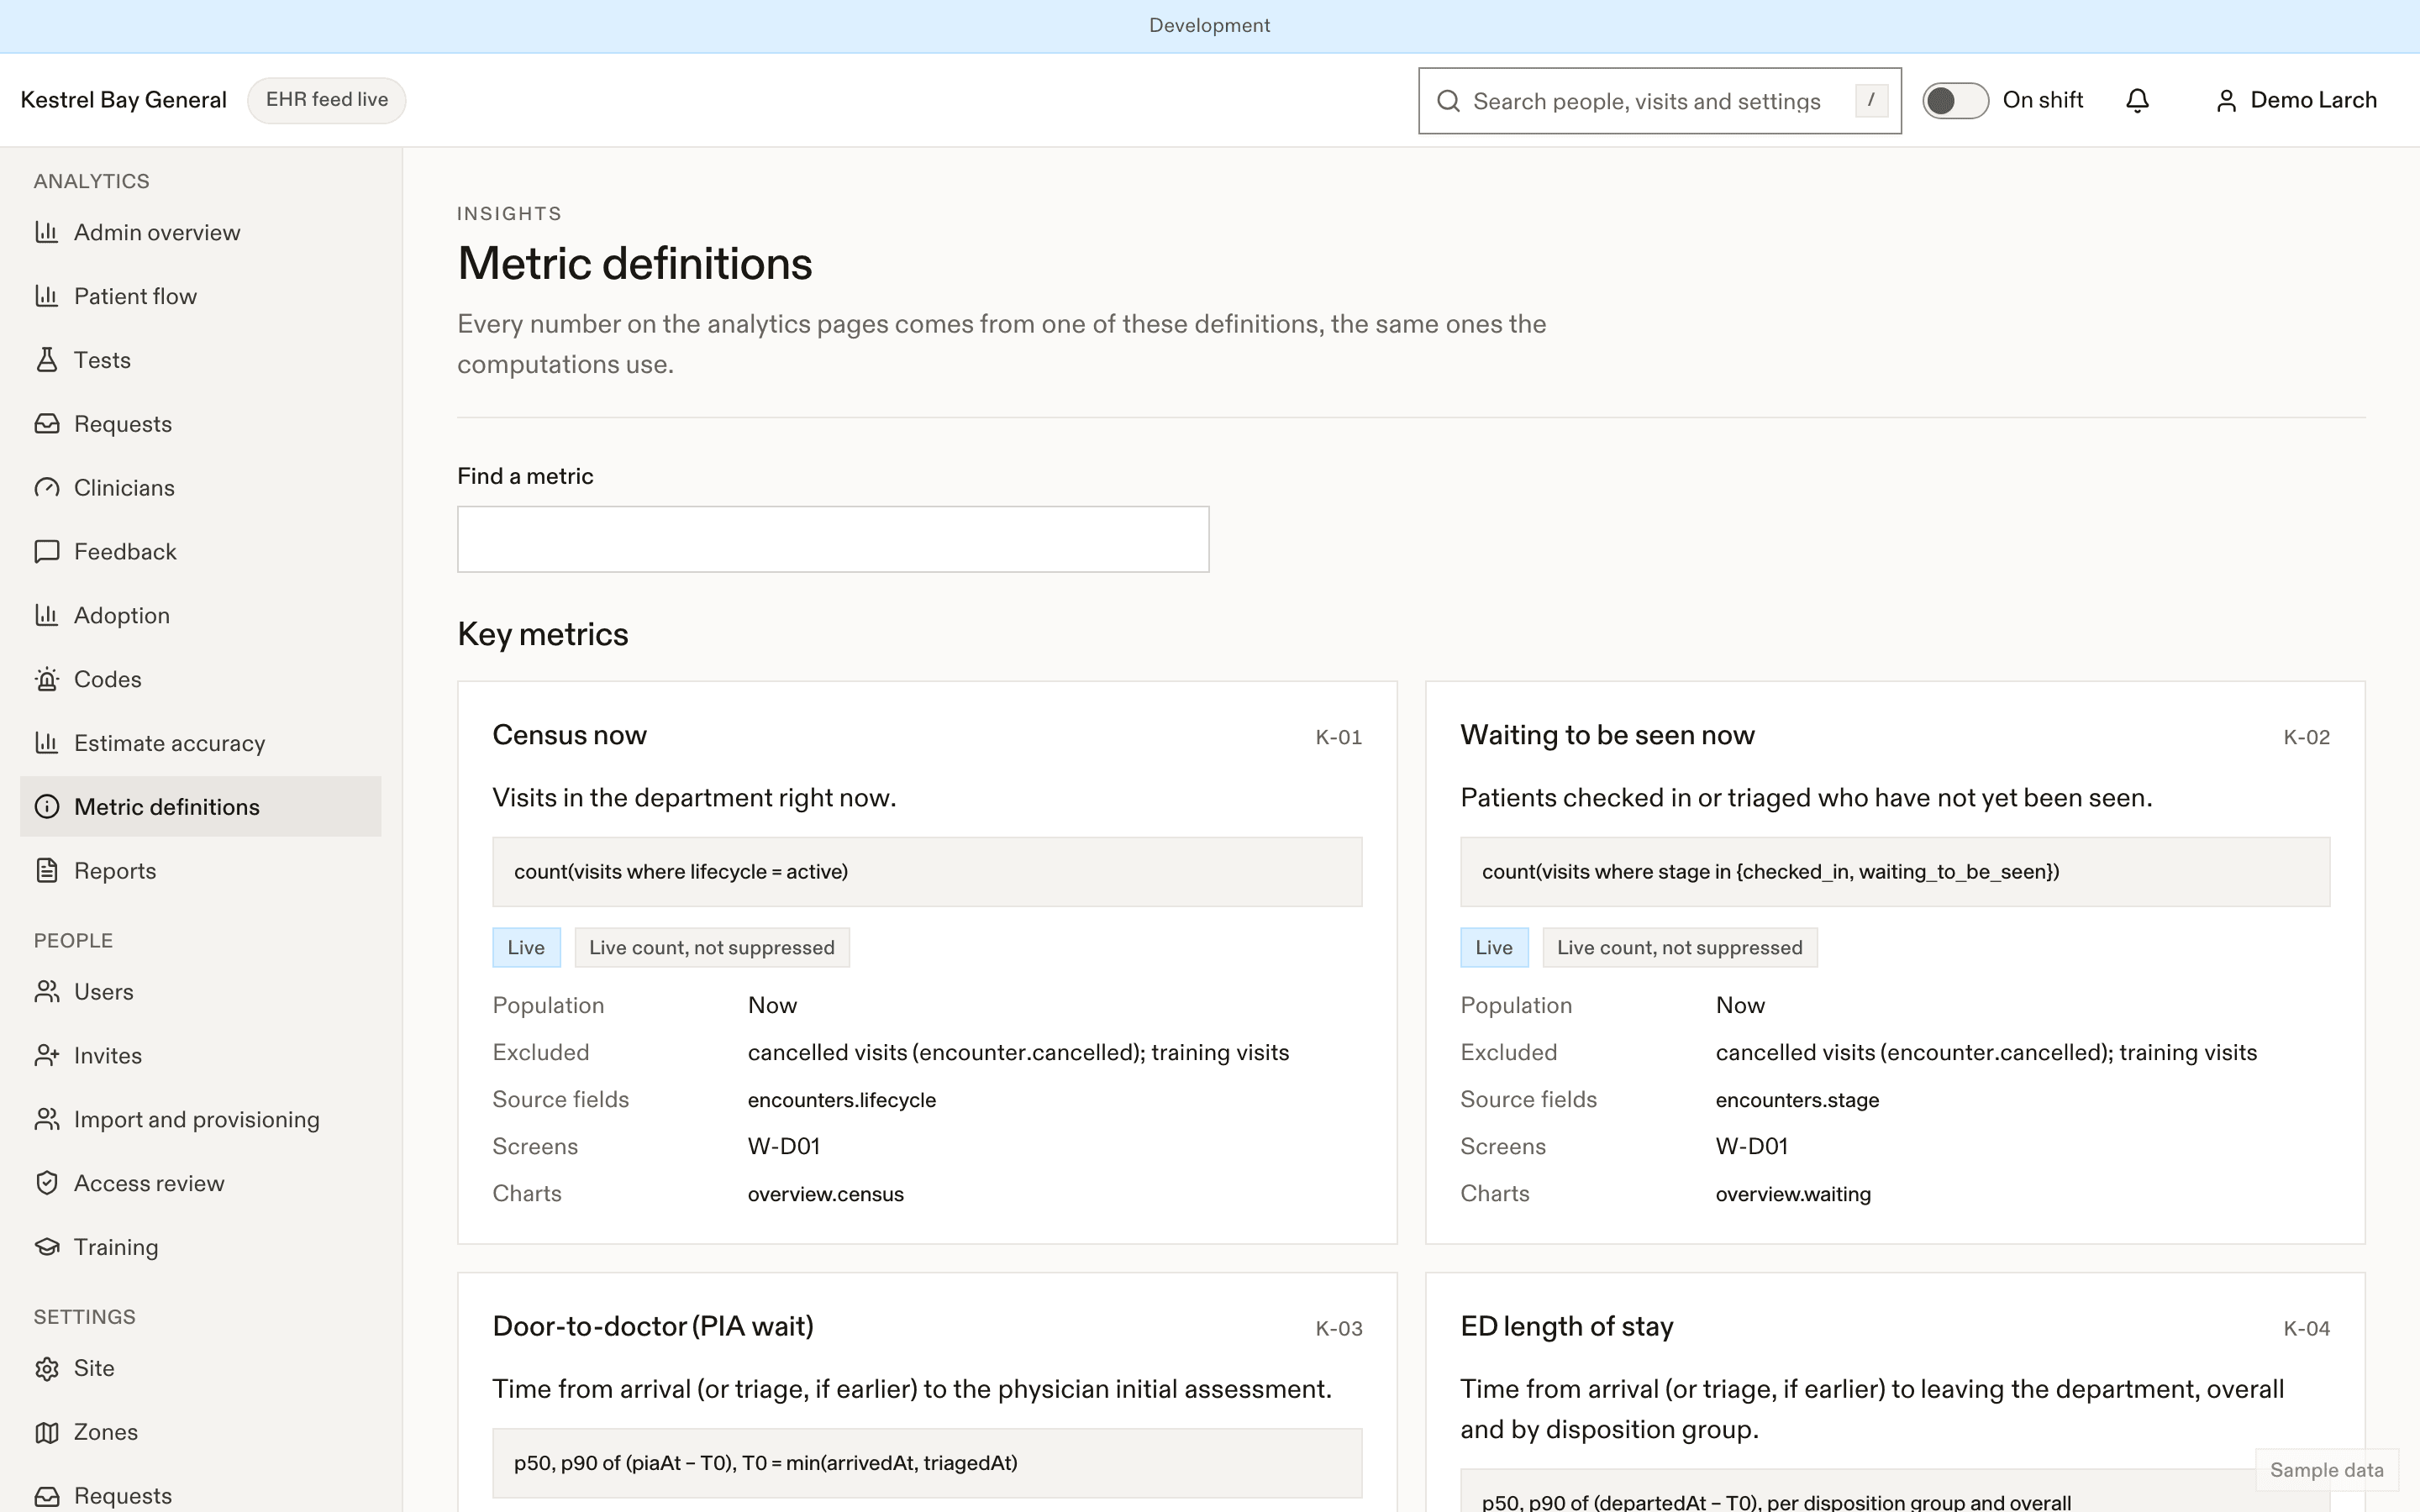
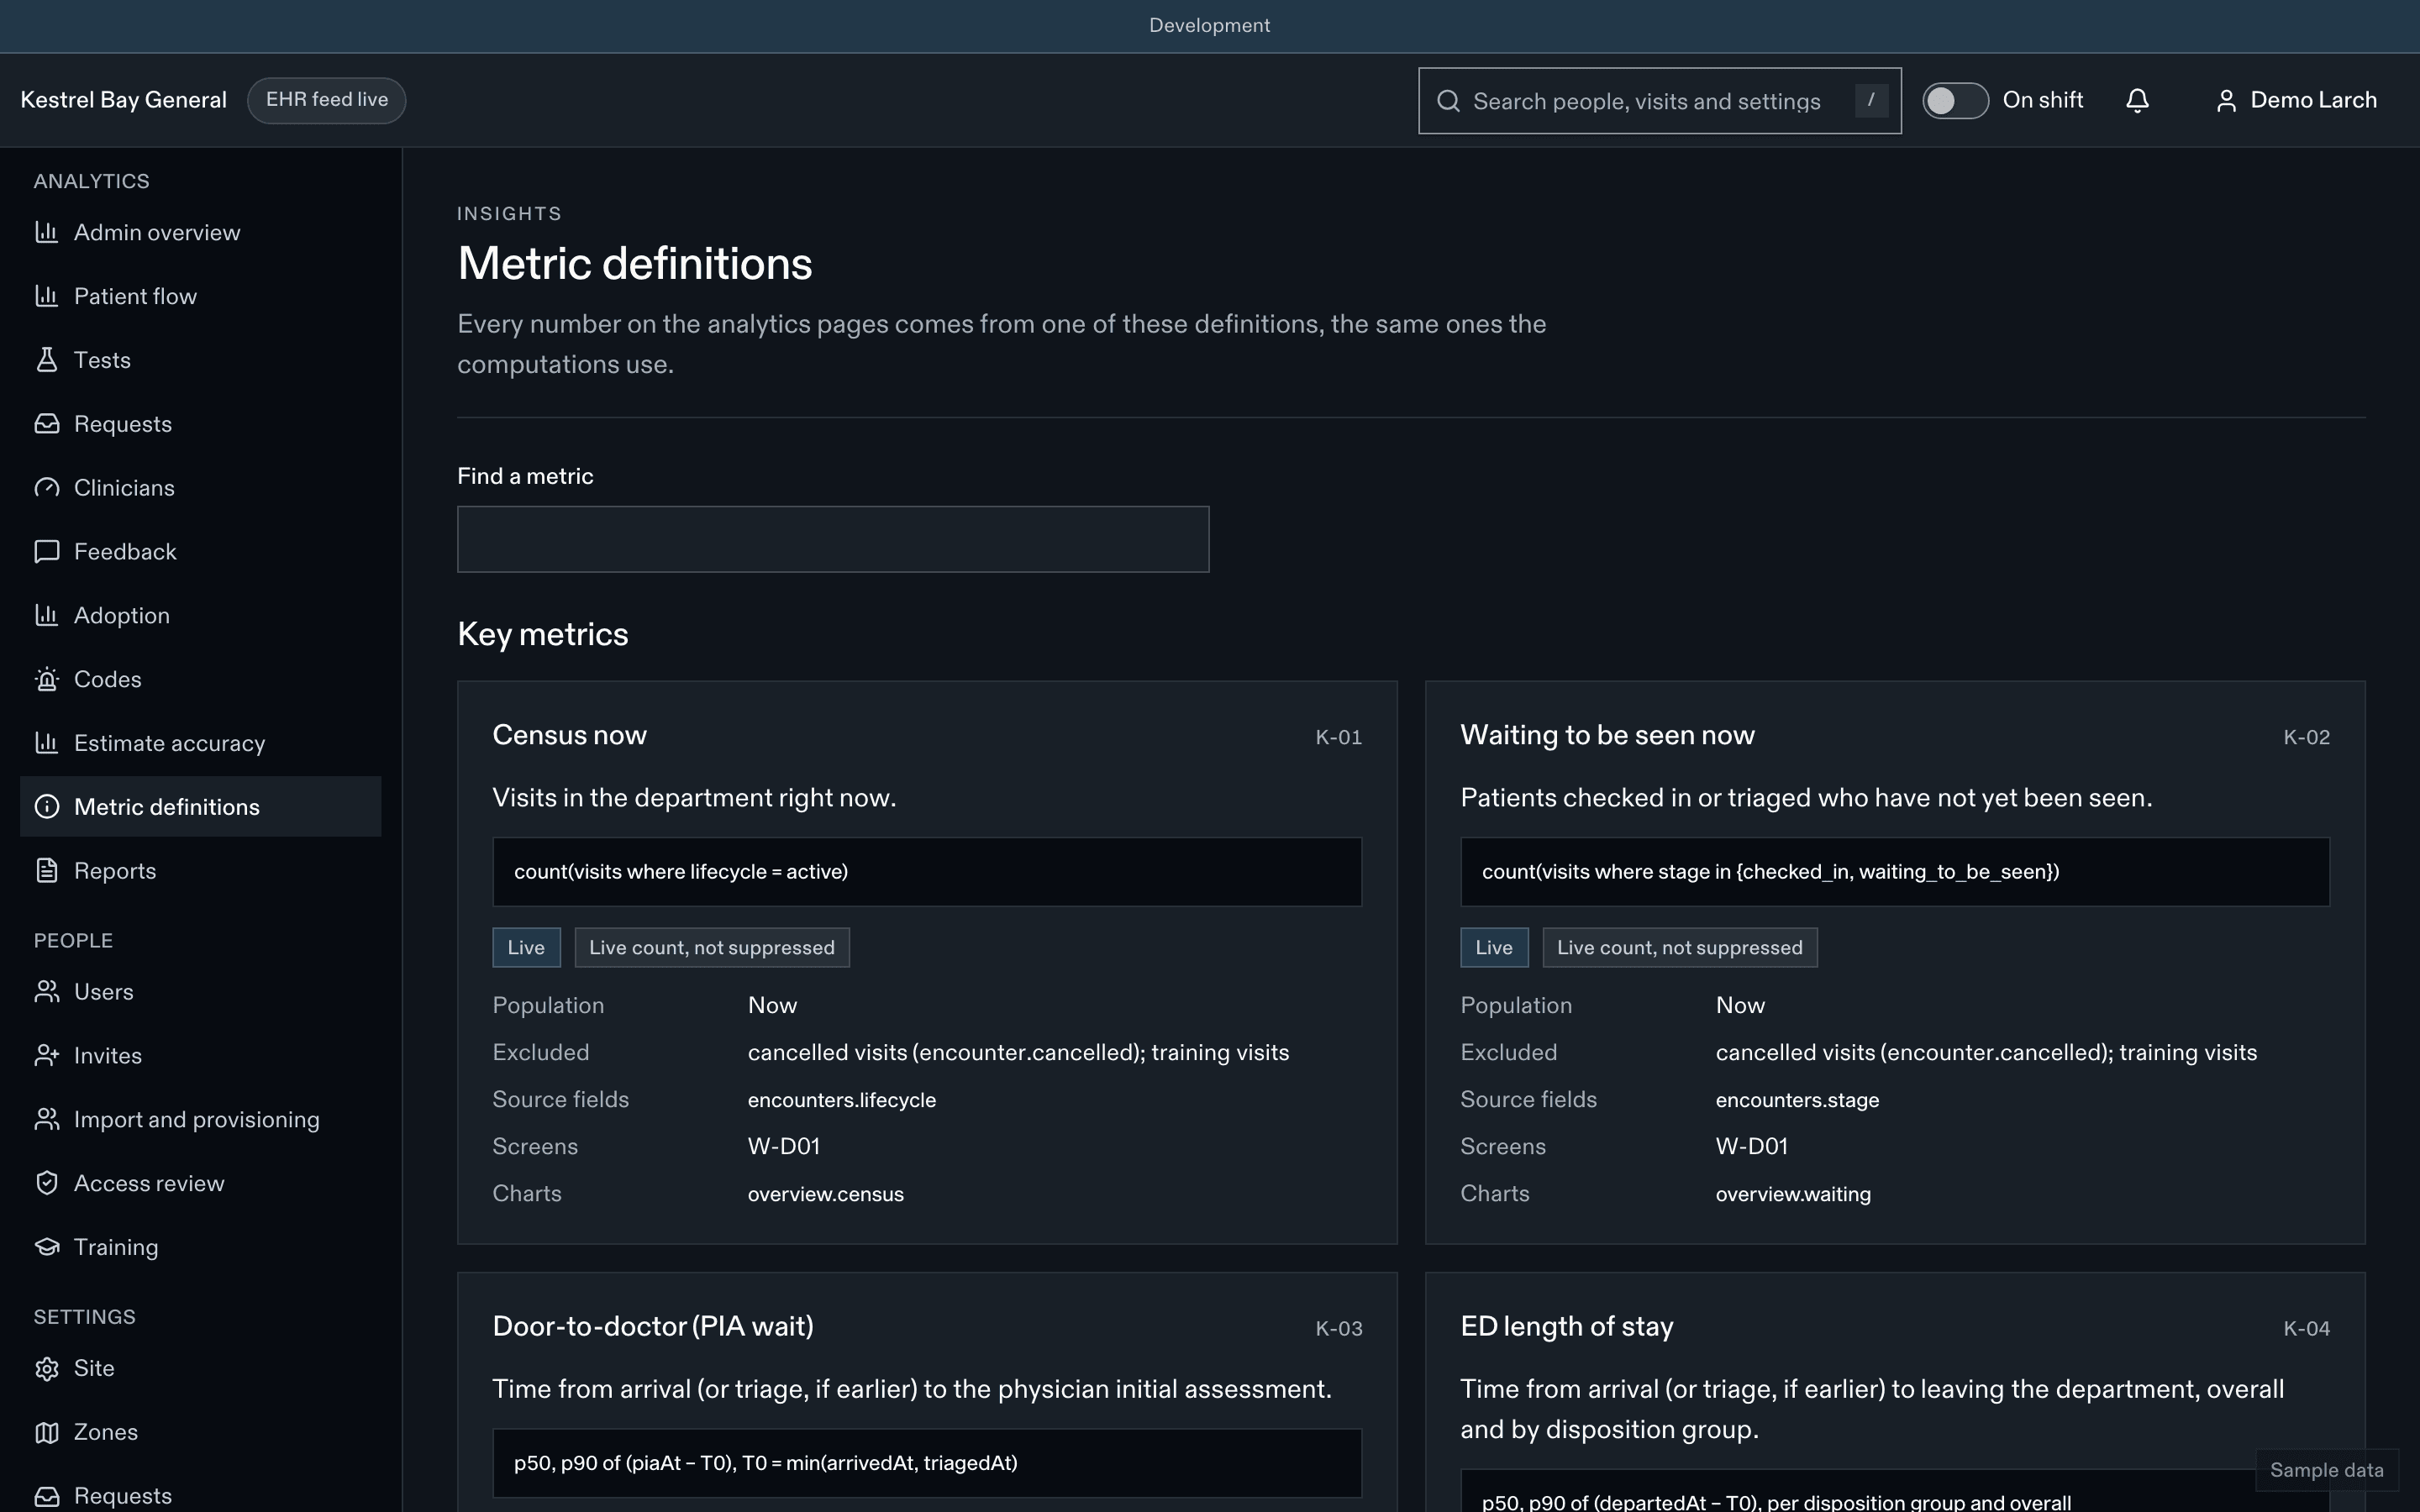
The full definitions, with formulas, inclusions and exclusions, source fields and references, are on Analytics → Definitions in the admin, readable by any staff role.
Last updated on