Flow and bottlenecks
Find where ED time is lost with EDFlow: flow segments from arrival to departure, the per-visit bottleneck flag, the period bottleneck ranking by excess minutes, heatmaps, trends and capacity drivers.
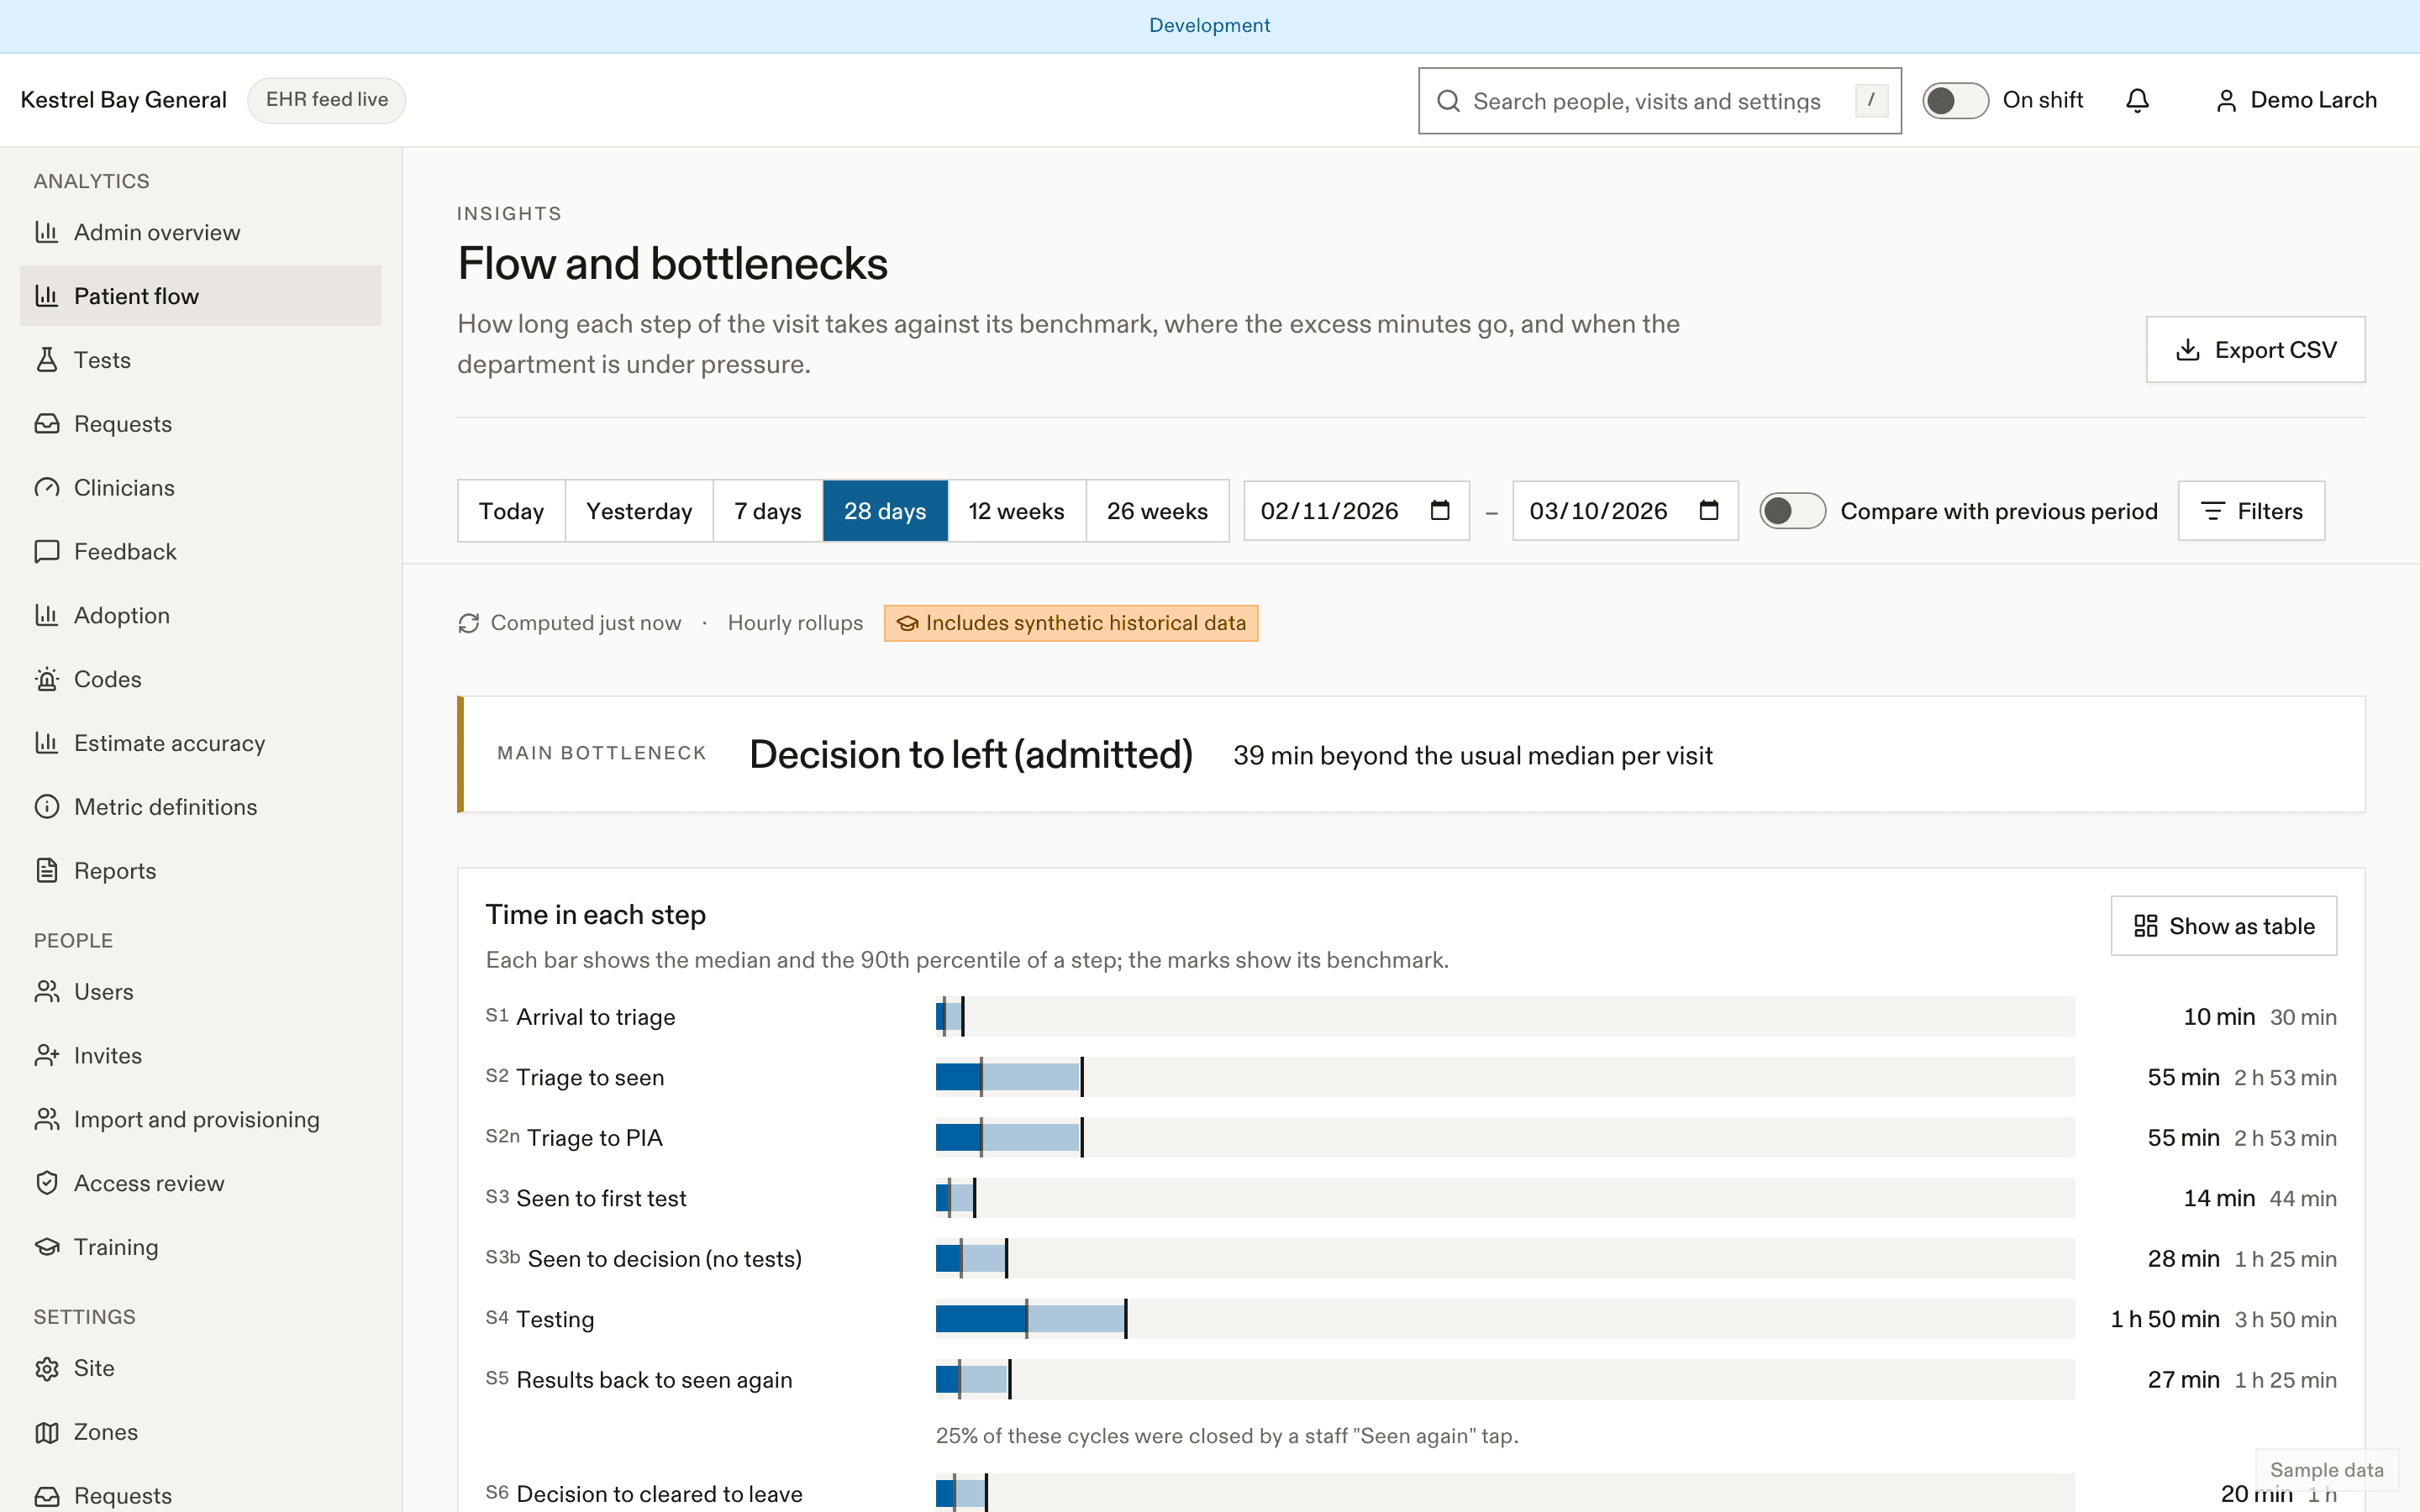
Segments
Every visit is split into segments:
| Segment | From | To | Patients see an estimate |
|---|---|---|---|
| S1 Arrival → triage | Arrival | Triage | Yes |
| S2 Triage → seen | Triage | Seen | Yes, by stream and CTAS |
| S2n Triage → PIA (NACRS) | Triage | PIA | No |
| S3 Seen → first test | Seen | First order | No |
| S3b Seen → decision, no tests | Seen | Decision | No |
| S4 Testing | Seen or first order | Last result complete before the decision | No |
| S5 Results → seen again | Results complete | Reassessment or decision | Yes |
| S5o Observation | Start | End | The plan only |
| S6 Decision → cleared to leave | Decision (home) | Cleared, or departure | Yes |
| S6c Cleared → left | Cleared | Departure | No |
| S6a Boarding | Decision (admit) | Departure | Only where the site allows it |
| S7 Consult | Requested | Specialist seen | Yes |
The bottleneck flag (per visit)
For each segment, EDFlow divides its duration by the p90 for its start bucket (site, weekday, hour). The visit's bottleneck is the segment with the highest ratio, when that ratio is 1 or more. The board's Bottleneck column shows it, and Time in stage is toned typical (below p75), longer (p75 to p90) or beyond (above p90).
The bottleneck ranking (period)
For each segment, excess minutes per visit = the sum of time beyond each visit's bucket p50, divided by the number of visits. The top segment is labelled Main bottleneck. Capacity drivers (boarder-hours, occupancy, physician hours) are shown next to it, so access block isn't read as an ED problem.
Charts
- p50 and p90 for each segment against its benchmark.
- Heatmaps (hour × weekday, 7 × 24 cells) for arrivals, door-to-doctor, LOS and LWBS rate.
- Weekly trends for door-to-doctor, LOS by disposition, results to reassessment and boarding.
- A histogram for each segment, and a breakdown by CTAS group and disposition.
Using it well
- Start with the main bottleneck and its capacity drivers.
- Results → seen again (S5) is often where a "Seen again" habit or a results-back digest helps.
- Compare with the pre-pilot baseline using the same definitions.
Related
- Analytics conventions
- Measuring ED flow on the product site
Dernière mise à jour le
Cette page vous a-t-elle été utile?
Analytics
EDFlow analytics conventions and every metric definition: time zones, T0, percentiles, small-cell suppression, Ontario LOS groups, filters, annotations and exports, generated from the same definitions the computations use.
Test turnaround
Test turnaround analytics in EDFlow: order-to-result and collection-to-result times per test, hour-by-weekday heatmaps, bucket coverage, the estimate level patients get, and the benchmark job.